Houma vs Immigrants from Northern Europe Child Poverty Under the Age of 16
COMPARE
Houma
Immigrants from Northern Europe
Child Poverty Under the Age of 16
Child Poverty Under the Age of 16 Comparison
Houma
Immigrants from Northern Europe
24.9%
CHILD POVERTY UNDER THE AGE OF 16
0.0/ 100
METRIC RATING
335th/ 347
METRIC RANK
13.6%
CHILD POVERTY UNDER THE AGE OF 16
99.6/ 100
METRIC RATING
36th/ 347
METRIC RANK
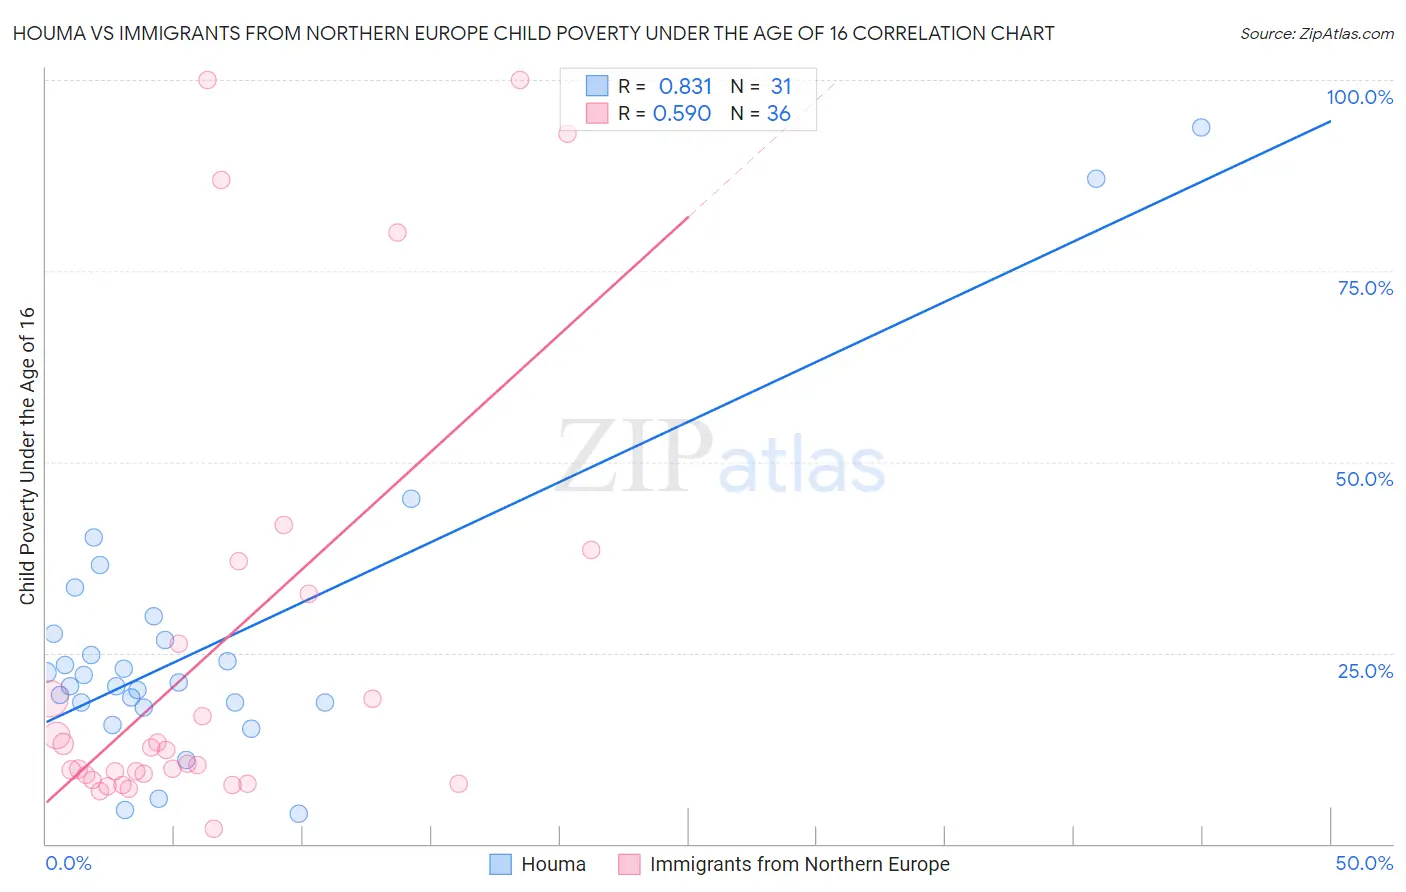
Houma vs Immigrants from Northern Europe Child Poverty Under the Age of 16 Correlation Chart
The statistical analysis conducted on geographies consisting of 36,741,016 people shows a very strong positive correlation between the proportion of Houma and poverty level among children under the age of 16 in the United States with a correlation coefficient (R) of 0.831 and weighted average of 24.9%. Similarly, the statistical analysis conducted on geographies consisting of 470,069,037 people shows a substantial positive correlation between the proportion of Immigrants from Northern Europe and poverty level among children under the age of 16 in the United States with a correlation coefficient (R) of 0.590 and weighted average of 13.6%, a difference of 83.3%.
Child Poverty Under the Age of 16 Correlation Summary
| Measurement | Houma | Immigrants from Northern Europe |
| Minimum | 3.9% | 2.0% |
| Maximum | 93.9% | 100.0% |
| Range | 89.9% | 98.0% |
| Mean | 26.1% | 25.2% |
| Median | 21.1% | 11.4% |
| Interquartile 25% (IQ1) | 18.5% | 8.7% |
| Interquartile 75% (IQ3) | 27.6% | 29.4% |
| Interquartile Range (IQR) | 9.1% | 20.7% |
| Standard Deviation (Sample) | 19.5% | 28.9% |
| Standard Deviation (Population) | 19.2% | 28.5% |
Similar Demographics by Child Poverty Under the Age of 16
Demographics Similar to Houma by Child Poverty Under the Age of 16
In terms of child poverty under the age of 16, the demographic groups most similar to Houma are Yup'ik (25.1%, a difference of 1.1%), Sioux (25.2%, a difference of 1.4%), Black/African American (24.4%, a difference of 1.7%), Cheyenne (25.4%, a difference of 2.1%), and Immigrants from Dominican Republic (24.0%, a difference of 3.7%).
| Demographics | Rating | Rank | Child Poverty Under the Age of 16 |
| Colville | 0.0 /100 | #328 | Tragic 23.0% |
| Dominicans | 0.0 /100 | #329 | Tragic 23.8% |
| Natives/Alaskans | 0.0 /100 | #330 | Tragic 23.8% |
| Apache | 0.0 /100 | #331 | Tragic 23.8% |
| Pueblo | 0.0 /100 | #332 | Tragic 23.9% |
| Immigrants | Dominican Republic | 0.0 /100 | #333 | Tragic 24.0% |
| Blacks/African Americans | 0.0 /100 | #334 | Tragic 24.4% |
| Houma | 0.0 /100 | #335 | Tragic 24.9% |
| Yup'ik | 0.0 /100 | #336 | Tragic 25.1% |
| Sioux | 0.0 /100 | #337 | Tragic 25.2% |
| Cheyenne | 0.0 /100 | #338 | Tragic 25.4% |
| Crow | 0.0 /100 | #339 | Tragic 26.0% |
| Hopi | 0.0 /100 | #340 | Tragic 27.1% |
| Yuman | 0.0 /100 | #341 | Tragic 28.9% |
| Pima | 0.0 /100 | #342 | Tragic 29.0% |
Demographics Similar to Immigrants from Northern Europe by Child Poverty Under the Age of 16
In terms of child poverty under the age of 16, the demographic groups most similar to Immigrants from Northern Europe are Immigrants from Bolivia (13.6%, a difference of 0.010%), Lithuanian (13.5%, a difference of 0.24%), Russian (13.5%, a difference of 0.44%), Luxembourger (13.6%, a difference of 0.52%), and Immigrants from Australia (13.6%, a difference of 0.55%).
| Demographics | Rating | Rank | Child Poverty Under the Age of 16 |
| Swedes | 99.7 /100 | #29 | Exceptional 13.3% |
| Turks | 99.7 /100 | #30 | Exceptional 13.4% |
| Danes | 99.7 /100 | #31 | Exceptional 13.4% |
| Tongans | 99.7 /100 | #32 | Exceptional 13.4% |
| Asians | 99.6 /100 | #33 | Exceptional 13.5% |
| Russians | 99.6 /100 | #34 | Exceptional 13.5% |
| Lithuanians | 99.6 /100 | #35 | Exceptional 13.5% |
| Immigrants | Northern Europe | 99.6 /100 | #36 | Exceptional 13.6% |
| Immigrants | Bolivia | 99.6 /100 | #37 | Exceptional 13.6% |
| Luxembourgers | 99.5 /100 | #38 | Exceptional 13.6% |
| Immigrants | Australia | 99.5 /100 | #39 | Exceptional 13.6% |
| Immigrants | Scotland | 99.4 /100 | #40 | Exceptional 13.7% |
| Croatians | 99.4 /100 | #41 | Exceptional 13.8% |
| Immigrants | Sri Lanka | 99.3 /100 | #42 | Exceptional 13.8% |
| Immigrants | Moldova | 99.3 /100 | #43 | Exceptional 13.8% |