Houma vs Bhutanese Single Father Households
COMPARE
Houma
Bhutanese
Single Father Households
Single Father Households Comparison
Houma
Bhutanese
2.9%
SINGLE FATHER HOUSEHOLDS
0.0/ 100
METRIC RATING
316th/ 347
METRIC RANK
2.1%
SINGLE FATHER HOUSEHOLDS
99.5/ 100
METRIC RATING
88th/ 347
METRIC RANK
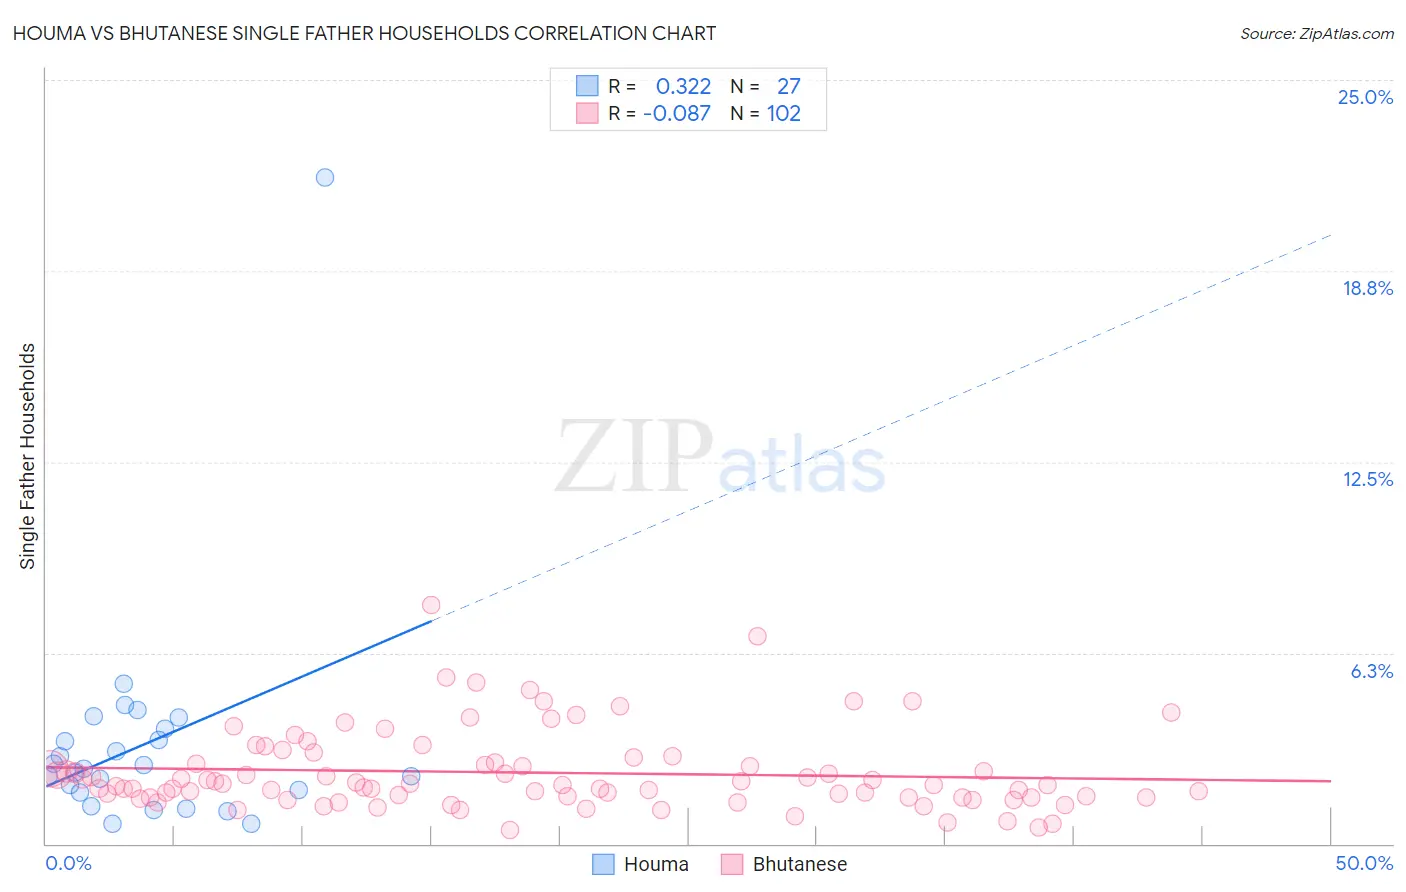
Houma vs Bhutanese Single Father Households Correlation Chart
The statistical analysis conducted on geographies consisting of 36,727,905 people shows a mild positive correlation between the proportion of Houma and percentage of single father households in the United States with a correlation coefficient (R) of 0.322 and weighted average of 2.9%. Similarly, the statistical analysis conducted on geographies consisting of 450,482,279 people shows a slight negative correlation between the proportion of Bhutanese and percentage of single father households in the United States with a correlation coefficient (R) of -0.087 and weighted average of 2.1%, a difference of 38.2%.
Single Father Households Correlation Summary
| Measurement | Houma | Bhutanese |
| Minimum | 0.65% | 0.45% |
| Maximum | 21.8% | 7.8% |
| Range | 21.2% | 7.4% |
| Mean | 3.3% | 2.3% |
| Median | 2.5% | 1.9% |
| Interquartile 25% (IQ1) | 1.7% | 1.5% |
| Interquartile 75% (IQ3) | 3.8% | 2.7% |
| Interquartile Range (IQR) | 2.1% | 1.1% |
| Standard Deviation (Sample) | 3.9% | 1.3% |
| Standard Deviation (Population) | 3.8% | 1.3% |
Similar Demographics by Single Father Households
Demographics Similar to Houma by Single Father Households
In terms of single father households, the demographic groups most similar to Houma are Cheyenne (2.9%, a difference of 0.0%), Salvadoran (2.9%, a difference of 0.39%), Arapaho (2.9%, a difference of 0.64%), Immigrants from El Salvador (2.9%, a difference of 0.86%), and Cape Verdean (2.9%, a difference of 0.87%).
| Demographics | Rating | Rank | Single Father Households |
| Central Americans | 0.0 /100 | #309 | Tragic 2.9% |
| Immigrants | Laos | 0.0 /100 | #310 | Tragic 2.9% |
| Spanish American Indians | 0.0 /100 | #311 | Tragic 2.9% |
| Tsimshian | 0.0 /100 | #312 | Tragic 2.9% |
| Arapaho | 0.0 /100 | #313 | Tragic 2.9% |
| Salvadorans | 0.0 /100 | #314 | Tragic 2.9% |
| Cheyenne | 0.0 /100 | #315 | Tragic 2.9% |
| Houma | 0.0 /100 | #316 | Tragic 2.9% |
| Immigrants | El Salvador | 0.0 /100 | #317 | Tragic 2.9% |
| Cape Verdeans | 0.0 /100 | #318 | Tragic 2.9% |
| Ute | 0.0 /100 | #319 | Tragic 3.0% |
| Guatemalans | 0.0 /100 | #320 | Tragic 3.0% |
| Mexicans | 0.0 /100 | #321 | Tragic 3.0% |
| Immigrants | Guatemala | 0.0 /100 | #322 | Tragic 3.0% |
| Immigrants | Central America | 0.0 /100 | #323 | Tragic 3.0% |
Demographics Similar to Bhutanese by Single Father Households
In terms of single father households, the demographic groups most similar to Bhutanese are Immigrants from Armenia (2.1%, a difference of 0.050%), Immigrants from Pakistan (2.1%, a difference of 0.060%), Lithuanian (2.1%, a difference of 0.13%), Immigrants from Guyana (2.1%, a difference of 0.30%), and Romanian (2.1%, a difference of 0.39%).
| Demographics | Rating | Rank | Single Father Households |
| Armenians | 99.7 /100 | #81 | Exceptional 2.1% |
| New Zealanders | 99.7 /100 | #82 | Exceptional 2.1% |
| Greeks | 99.7 /100 | #83 | Exceptional 2.1% |
| Carpatho Rusyns | 99.6 /100 | #84 | Exceptional 2.1% |
| Immigrants | Hungary | 99.6 /100 | #85 | Exceptional 2.1% |
| Asians | 99.6 /100 | #86 | Exceptional 2.1% |
| Lithuanians | 99.5 /100 | #87 | Exceptional 2.1% |
| Bhutanese | 99.5 /100 | #88 | Exceptional 2.1% |
| Immigrants | Armenia | 99.5 /100 | #89 | Exceptional 2.1% |
| Immigrants | Pakistan | 99.5 /100 | #90 | Exceptional 2.1% |
| Immigrants | Guyana | 99.4 /100 | #91 | Exceptional 2.1% |
| Romanians | 99.4 /100 | #92 | Exceptional 2.1% |
| Croatians | 99.3 /100 | #93 | Exceptional 2.1% |
| Ukrainians | 99.3 /100 | #94 | Exceptional 2.1% |
| Bermudans | 99.2 /100 | #95 | Exceptional 2.1% |