Immigrants from Cameroon vs Bhutanese Per Capita Income
COMPARE
Immigrants from Cameroon
Bhutanese
Per Capita Income
Per Capita Income Comparison
Immigrants from Cameroon
Bhutanese
$41,334
PER CAPITA INCOME
6.8/ 100
METRIC RATING
223rd/ 347
METRIC RANK
$49,894
PER CAPITA INCOME
99.9/ 100
METRIC RATING
59th/ 347
METRIC RANK
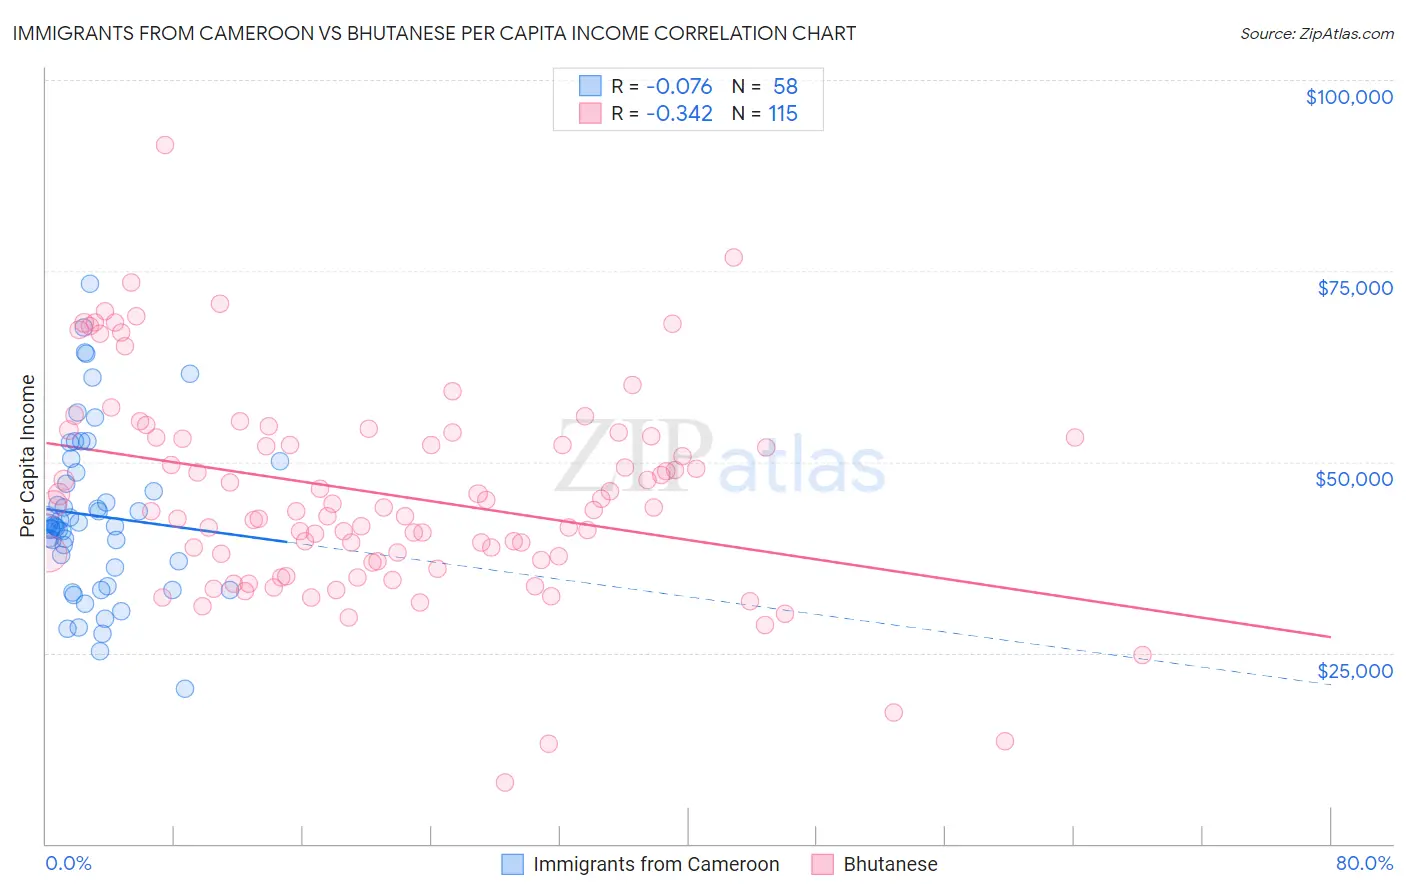
Immigrants from Cameroon vs Bhutanese Per Capita Income Correlation Chart
The statistical analysis conducted on geographies consisting of 130,769,320 people shows a slight negative correlation between the proportion of Immigrants from Cameroon and per capita income in the United States with a correlation coefficient (R) of -0.076 and weighted average of $41,334. Similarly, the statistical analysis conducted on geographies consisting of 455,599,247 people shows a mild negative correlation between the proportion of Bhutanese and per capita income in the United States with a correlation coefficient (R) of -0.342 and weighted average of $49,894, a difference of 20.7%.
Per Capita Income Correlation Summary
| Measurement | Immigrants from Cameroon | Bhutanese |
| Minimum | $20,282 | $8,097 |
| Maximum | $73,301 | $91,569 |
| Range | $53,019 | $83,472 |
| Mean | $42,979 | $45,753 |
| Median | $41,647 | $44,077 |
| Interquartile 25% (IQ1) | $36,092 | $37,217 |
| Interquartile 75% (IQ3) | $48,673 | $53,334 |
| Interquartile Range (IQR) | $12,582 | $16,117 |
| Standard Deviation (Sample) | $10,877 | $13,593 |
| Standard Deviation (Population) | $10,783 | $13,533 |
Similar Demographics by Per Capita Income
Demographics Similar to Immigrants from Cameroon by Per Capita Income
In terms of per capita income, the demographic groups most similar to Immigrants from Cameroon are Immigrants from Iraq ($41,365, a difference of 0.070%), Immigrants from St. Vincent and the Grenadines ($41,270, a difference of 0.16%), West Indian ($41,217, a difference of 0.28%), Immigrants from Trinidad and Tobago ($41,476, a difference of 0.34%), and Immigrants from Ecuador ($41,195, a difference of 0.34%).
| Demographics | Rating | Rank | Per Capita Income |
| Tongans | 9.9 /100 | #216 | Tragic $41,693 |
| Guamanians/Chamorros | 9.7 /100 | #217 | Tragic $41,678 |
| Trinidadians and Tobagonians | 9.5 /100 | #218 | Tragic $41,655 |
| Puget Sound Salish | 8.1 /100 | #219 | Tragic $41,495 |
| Immigrants | Barbados | 7.9 /100 | #220 | Tragic $41,478 |
| Immigrants | Trinidad and Tobago | 7.9 /100 | #221 | Tragic $41,476 |
| Immigrants | Iraq | 7.1 /100 | #222 | Tragic $41,365 |
| Immigrants | Cameroon | 6.8 /100 | #223 | Tragic $41,334 |
| Immigrants | St. Vincent and the Grenadines | 6.4 /100 | #224 | Tragic $41,270 |
| West Indians | 6.0 /100 | #225 | Tragic $41,217 |
| Immigrants | Ecuador | 5.9 /100 | #226 | Tragic $41,195 |
| Immigrants | Ghana | 5.5 /100 | #227 | Tragic $41,131 |
| Immigrants | Grenada | 5.5 /100 | #228 | Tragic $41,123 |
| Nigerians | 4.9 /100 | #229 | Tragic $41,026 |
| Native Hawaiians | 4.9 /100 | #230 | Tragic $41,017 |
Demographics Similar to Bhutanese by Per Capita Income
In terms of per capita income, the demographic groups most similar to Bhutanese are Immigrants from Scotland ($49,893, a difference of 0.0%), Argentinean ($49,862, a difference of 0.070%), Immigrants from Malaysia ($49,983, a difference of 0.18%), South African ($50,044, a difference of 0.30%), and Immigrants from Asia ($49,741, a difference of 0.31%).
| Demographics | Rating | Rank | Per Capita Income |
| Immigrants | Croatia | 99.9 /100 | #52 | Exceptional $50,417 |
| Paraguayans | 99.9 /100 | #53 | Exceptional $50,385 |
| Immigrants | Belarus | 99.9 /100 | #54 | Exceptional $50,303 |
| Immigrants | Western Europe | 99.9 /100 | #55 | Exceptional $50,065 |
| Asians | 99.9 /100 | #56 | Exceptional $50,057 |
| South Africans | 99.9 /100 | #57 | Exceptional $50,044 |
| Immigrants | Malaysia | 99.9 /100 | #58 | Exceptional $49,983 |
| Bhutanese | 99.9 /100 | #59 | Exceptional $49,894 |
| Immigrants | Scotland | 99.9 /100 | #60 | Exceptional $49,893 |
| Argentineans | 99.9 /100 | #61 | Exceptional $49,862 |
| Immigrants | Asia | 99.9 /100 | #62 | Exceptional $49,741 |
| Maltese | 99.9 /100 | #63 | Exceptional $49,640 |
| Immigrants | Argentina | 99.9 /100 | #64 | Exceptional $49,627 |
| Bolivians | 99.9 /100 | #65 | Exceptional $49,526 |
| Immigrants | Bulgaria | 99.9 /100 | #66 | Exceptional $49,482 |