Hopi vs Filipino Householder Income Over 65 years
COMPARE
Hopi
Filipino
Householder Income Over 65 years
Householder Income Over 65 years Comparison
Hopi
Filipinos
$50,925
HOUSEHOLDER INCOME OVER 65 YEARS
0.0/ 100
METRIC RATING
328th/ 347
METRIC RANK
$76,686
HOUSEHOLDER INCOME OVER 65 YEARS
100.0/ 100
METRIC RATING
4th/ 347
METRIC RANK
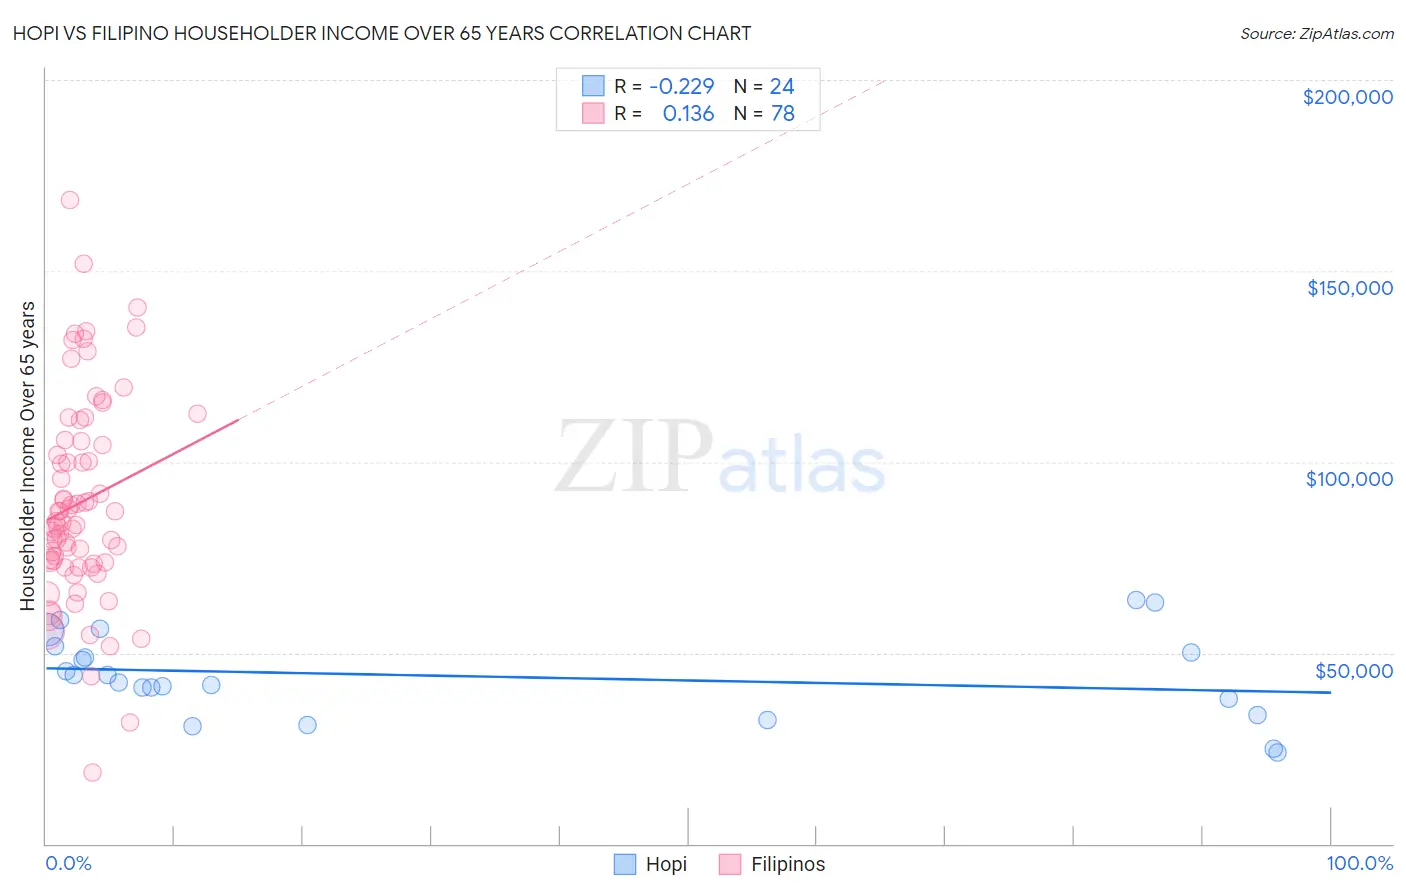
Hopi vs Filipino Householder Income Over 65 years Correlation Chart
The statistical analysis conducted on geographies consisting of 74,624,993 people shows a weak negative correlation between the proportion of Hopi and household income with householder over the age of 65 in the United States with a correlation coefficient (R) of -0.229 and weighted average of $50,925. Similarly, the statistical analysis conducted on geographies consisting of 253,664,228 people shows a poor positive correlation between the proportion of Filipinos and household income with householder over the age of 65 in the United States with a correlation coefficient (R) of 0.136 and weighted average of $76,686, a difference of 50.6%.
Householder Income Over 65 years Correlation Summary
| Measurement | Hopi | Filipino |
| Minimum | $23,945 | $18,667 |
| Maximum | $63,889 | $168,449 |
| Range | $39,944 | $149,782 |
| Mean | $43,849 | $89,373 |
| Median | $43,086 | $84,207 |
| Interquartile 25% (IQ1) | $35,807 | $73,750 |
| Interquartile 75% (IQ3) | $50,986 | $105,277 |
| Interquartile Range (IQR) | $15,179 | $31,527 |
| Standard Deviation (Sample) | $11,101 | $26,949 |
| Standard Deviation (Population) | $10,867 | $26,776 |
Similar Demographics by Householder Income Over 65 years
Demographics Similar to Hopi by Householder Income Over 65 years
In terms of householder income over 65 years, the demographic groups most similar to Hopi are Bahamian ($51,000, a difference of 0.15%), Black/African American ($50,779, a difference of 0.29%), Immigrants from Grenada ($50,747, a difference of 0.35%), Kiowa ($51,140, a difference of 0.42%), and Immigrants from Haiti ($51,219, a difference of 0.58%).
| Demographics | Rating | Rank | Householder Income Over 65 years |
| Menominee | 0.0 /100 | #321 | Tragic $51,719 |
| British West Indians | 0.0 /100 | #322 | Tragic $51,463 |
| Cajuns | 0.0 /100 | #323 | Tragic $51,397 |
| Immigrants | Congo | 0.0 /100 | #324 | Tragic $51,393 |
| Immigrants | Haiti | 0.0 /100 | #325 | Tragic $51,219 |
| Kiowa | 0.0 /100 | #326 | Tragic $51,140 |
| Bahamians | 0.0 /100 | #327 | Tragic $51,000 |
| Hopi | 0.0 /100 | #328 | Tragic $50,925 |
| Blacks/African Americans | 0.0 /100 | #329 | Tragic $50,779 |
| Immigrants | Grenada | 0.0 /100 | #330 | Tragic $50,747 |
| Pima | 0.0 /100 | #331 | Tragic $50,539 |
| Dutch West Indians | 0.0 /100 | #332 | Tragic $50,475 |
| Cape Verdeans | 0.0 /100 | #333 | Tragic $50,077 |
| Immigrants | Dominica | 0.0 /100 | #334 | Tragic $50,071 |
| Crow | 0.0 /100 | #335 | Tragic $49,234 |
Demographics Similar to Filipinos by Householder Income Over 65 years
In terms of householder income over 65 years, the demographic groups most similar to Filipinos are Immigrants from Taiwan ($77,051, a difference of 0.48%), Iranian ($77,429, a difference of 0.97%), Chinese ($77,465, a difference of 1.0%), Immigrants from Iran ($75,081, a difference of 2.1%), and Bolivian ($74,245, a difference of 3.3%).
| Demographics | Rating | Rank | Householder Income Over 65 years |
| Chinese | 100.0 /100 | #1 | Exceptional $77,465 |
| Iranians | 100.0 /100 | #2 | Exceptional $77,429 |
| Immigrants | Taiwan | 100.0 /100 | #3 | Exceptional $77,051 |
| Filipinos | 100.0 /100 | #4 | Exceptional $76,686 |
| Immigrants | Iran | 100.0 /100 | #5 | Exceptional $75,081 |
| Bolivians | 100.0 /100 | #6 | Exceptional $74,245 |
| Immigrants | Bolivia | 100.0 /100 | #7 | Exceptional $73,434 |
| Immigrants | Singapore | 100.0 /100 | #8 | Exceptional $72,963 |
| Immigrants | India | 100.0 /100 | #9 | Exceptional $72,804 |
| Bhutanese | 100.0 /100 | #10 | Exceptional $72,288 |
| Thais | 100.0 /100 | #11 | Exceptional $72,099 |
| Cypriots | 100.0 /100 | #12 | Exceptional $71,714 |
| Immigrants | Hong Kong | 100.0 /100 | #13 | Exceptional $71,567 |
| Burmese | 100.0 /100 | #14 | Exceptional $71,139 |
| Native Hawaiians | 100.0 /100 | #15 | Exceptional $71,021 |