Hopi vs Bolivian Median Earnings
COMPARE
Hopi
Bolivian
Median Earnings
Median Earnings Comparison
Hopi
Bolivians
$36,871
MEDIAN EARNINGS
0.0/ 100
METRIC RATING
342nd/ 347
METRIC RANK
$52,005
MEDIAN EARNINGS
100.0/ 100
METRIC RATING
49th/ 347
METRIC RANK
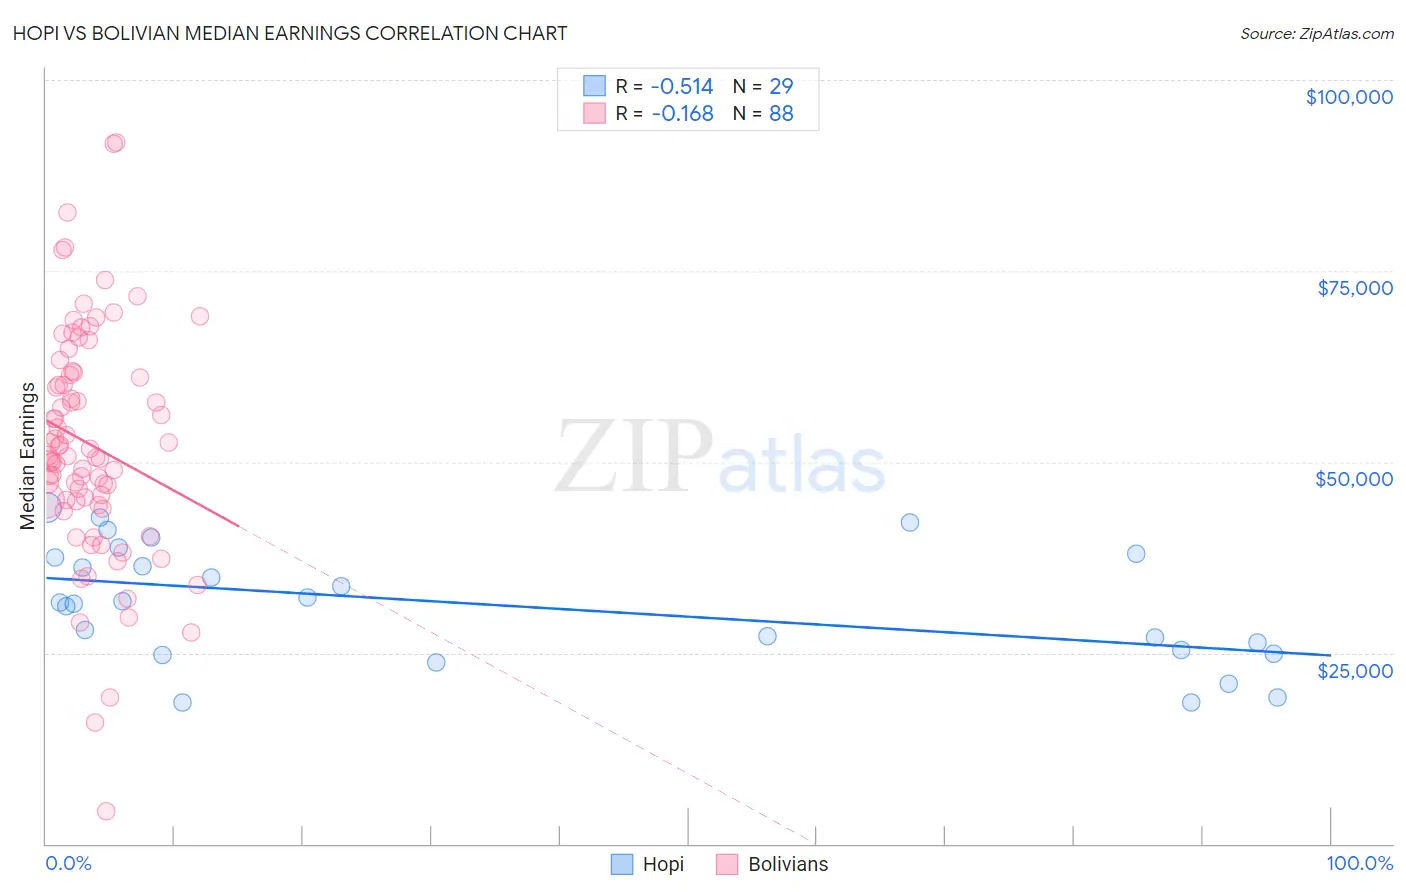
Hopi vs Bolivian Median Earnings Correlation Chart
The statistical analysis conducted on geographies consisting of 74,737,278 people shows a substantial negative correlation between the proportion of Hopi and median earnings in the United States with a correlation coefficient (R) of -0.514 and weighted average of $36,871. Similarly, the statistical analysis conducted on geographies consisting of 184,675,536 people shows a poor negative correlation between the proportion of Bolivians and median earnings in the United States with a correlation coefficient (R) of -0.168 and weighted average of $52,005, a difference of 41.0%.
Median Earnings Correlation Summary
| Measurement | Hopi | Bolivian |
| Minimum | $18,419 | $4,250 |
| Maximum | $44,002 | $91,786 |
| Range | $25,583 | $87,536 |
| Mean | $31,290 | $52,342 |
| Median | $31,645 | $50,729 |
| Interquartile 25% (IQ1) | $25,144 | $44,853 |
| Interquartile 75% (IQ3) | $37,681 | $61,590 |
| Interquartile Range (IQR) | $12,537 | $16,737 |
| Standard Deviation (Sample) | $7,605 | $15,104 |
| Standard Deviation (Population) | $7,472 | $15,018 |
Similar Demographics by Median Earnings
Demographics Similar to Hopi by Median Earnings
In terms of median earnings, the demographic groups most similar to Hopi are Lumbee ($36,876, a difference of 0.010%), Pueblo ($36,859, a difference of 0.030%), Navajo ($36,999, a difference of 0.35%), Arapaho ($36,586, a difference of 0.78%), and Tohono O'odham ($36,349, a difference of 1.4%).
| Demographics | Rating | Rank | Median Earnings |
| Houma | 0.0 /100 | #333 | Tragic $38,949 |
| Spanish American Indians | 0.0 /100 | #334 | Tragic $38,907 |
| Natives/Alaskans | 0.0 /100 | #335 | Tragic $38,896 |
| Crow | 0.0 /100 | #336 | Tragic $38,707 |
| Immigrants | Cuba | 0.0 /100 | #337 | Tragic $38,426 |
| Pima | 0.0 /100 | #338 | Tragic $38,285 |
| Menominee | 0.0 /100 | #339 | Tragic $37,884 |
| Navajo | 0.0 /100 | #340 | Tragic $36,999 |
| Lumbee | 0.0 /100 | #341 | Tragic $36,876 |
| Hopi | 0.0 /100 | #342 | Tragic $36,871 |
| Pueblo | 0.0 /100 | #343 | Tragic $36,859 |
| Arapaho | 0.0 /100 | #344 | Tragic $36,586 |
| Tohono O'odham | 0.0 /100 | #345 | Tragic $36,349 |
| Yup'ik | 0.0 /100 | #346 | Tragic $35,942 |
| Puerto Ricans | 0.0 /100 | #347 | Tragic $35,560 |
Demographics Similar to Bolivians by Median Earnings
In terms of median earnings, the demographic groups most similar to Bolivians are Immigrants from South Africa ($51,850, a difference of 0.30%), Immigrants from Austria ($51,826, a difference of 0.35%), Immigrants from Europe ($52,195, a difference of 0.37%), Estonian ($51,772, a difference of 0.45%), and Immigrants from Norway ($51,758, a difference of 0.48%).
| Demographics | Rating | Rank | Median Earnings |
| Maltese | 100.0 /100 | #42 | Exceptional $52,526 |
| Immigrants | Malaysia | 100.0 /100 | #43 | Exceptional $52,514 |
| Bulgarians | 100.0 /100 | #44 | Exceptional $52,512 |
| Immigrants | Czechoslovakia | 100.0 /100 | #45 | Exceptional $52,361 |
| Bhutanese | 100.0 /100 | #46 | Exceptional $52,297 |
| Australians | 100.0 /100 | #47 | Exceptional $52,294 |
| Immigrants | Europe | 100.0 /100 | #48 | Exceptional $52,195 |
| Bolivians | 100.0 /100 | #49 | Exceptional $52,005 |
| Immigrants | South Africa | 100.0 /100 | #50 | Exceptional $51,850 |
| Immigrants | Austria | 99.9 /100 | #51 | Exceptional $51,826 |
| Estonians | 99.9 /100 | #52 | Exceptional $51,772 |
| Immigrants | Norway | 99.9 /100 | #53 | Exceptional $51,758 |
| Immigrants | Indonesia | 99.9 /100 | #54 | Exceptional $51,715 |
| Egyptians | 99.9 /100 | #55 | Exceptional $51,701 |
| Immigrants | Pakistan | 99.9 /100 | #56 | Exceptional $51,693 |