Hopi vs English Median Earnings
COMPARE
Hopi
English
Median Earnings
Median Earnings Comparison
Hopi
English
$36,871
MEDIAN EARNINGS
0.0/ 100
METRIC RATING
342nd/ 347
METRIC RANK
$46,334
MEDIAN EARNINGS
46.5/ 100
METRIC RATING
179th/ 347
METRIC RANK
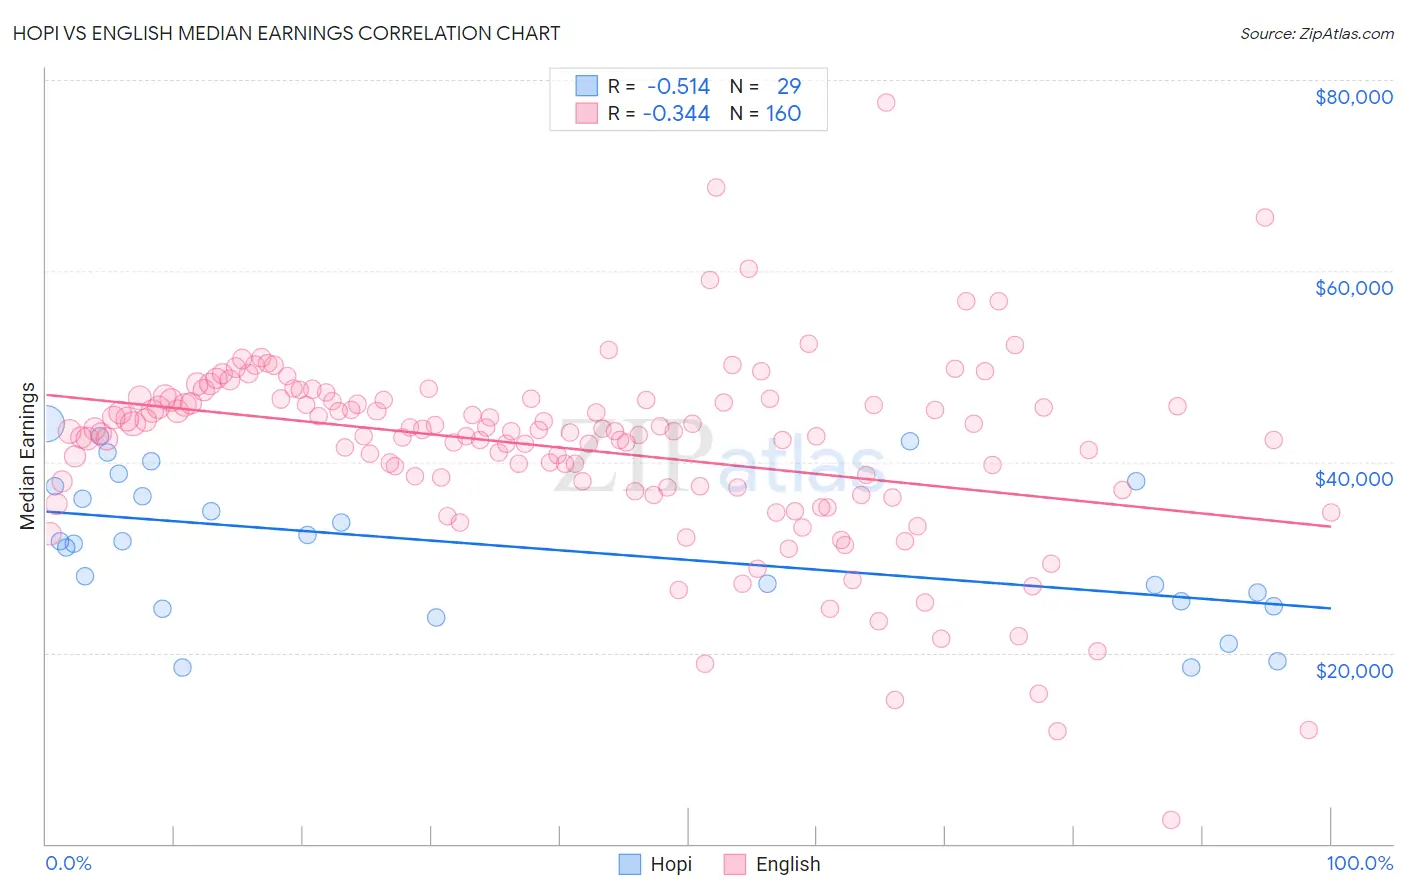
Hopi vs English Median Earnings Correlation Chart
The statistical analysis conducted on geographies consisting of 74,737,278 people shows a substantial negative correlation between the proportion of Hopi and median earnings in the United States with a correlation coefficient (R) of -0.514 and weighted average of $36,871. Similarly, the statistical analysis conducted on geographies consisting of 579,205,979 people shows a mild negative correlation between the proportion of English and median earnings in the United States with a correlation coefficient (R) of -0.344 and weighted average of $46,334, a difference of 25.7%.
Median Earnings Correlation Summary
| Measurement | Hopi | English |
| Minimum | $18,419 | $2,499 |
| Maximum | $44,002 | $77,673 |
| Range | $25,583 | $75,174 |
| Mean | $31,290 | $41,372 |
| Median | $31,645 | $43,164 |
| Interquartile 25% (IQ1) | $25,144 | $37,358 |
| Interquartile 75% (IQ3) | $37,681 | $46,458 |
| Interquartile Range (IQR) | $12,537 | $9,099 |
| Standard Deviation (Sample) | $7,605 | $9,981 |
| Standard Deviation (Population) | $7,472 | $9,950 |
Similar Demographics by Median Earnings
Demographics Similar to Hopi by Median Earnings
In terms of median earnings, the demographic groups most similar to Hopi are Lumbee ($36,876, a difference of 0.010%), Pueblo ($36,859, a difference of 0.030%), Navajo ($36,999, a difference of 0.35%), Arapaho ($36,586, a difference of 0.78%), and Tohono O'odham ($36,349, a difference of 1.4%).
| Demographics | Rating | Rank | Median Earnings |
| Houma | 0.0 /100 | #333 | Tragic $38,949 |
| Spanish American Indians | 0.0 /100 | #334 | Tragic $38,907 |
| Natives/Alaskans | 0.0 /100 | #335 | Tragic $38,896 |
| Crow | 0.0 /100 | #336 | Tragic $38,707 |
| Immigrants | Cuba | 0.0 /100 | #337 | Tragic $38,426 |
| Pima | 0.0 /100 | #338 | Tragic $38,285 |
| Menominee | 0.0 /100 | #339 | Tragic $37,884 |
| Navajo | 0.0 /100 | #340 | Tragic $36,999 |
| Lumbee | 0.0 /100 | #341 | Tragic $36,876 |
| Hopi | 0.0 /100 | #342 | Tragic $36,871 |
| Pueblo | 0.0 /100 | #343 | Tragic $36,859 |
| Arapaho | 0.0 /100 | #344 | Tragic $36,586 |
| Tohono O'odham | 0.0 /100 | #345 | Tragic $36,349 |
| Yup'ik | 0.0 /100 | #346 | Tragic $35,942 |
| Puerto Ricans | 0.0 /100 | #347 | Tragic $35,560 |
Demographics Similar to English by Median Earnings
In terms of median earnings, the demographic groups most similar to English are Puget Sound Salish ($46,333, a difference of 0.0%), Immigrants from Cameroon ($46,329, a difference of 0.010%), Colombian ($46,349, a difference of 0.030%), Swiss ($46,315, a difference of 0.040%), and French ($46,296, a difference of 0.080%).
| Demographics | Rating | Rank | Median Earnings |
| Kenyans | 51.0 /100 | #172 | Average $46,462 |
| Ghanaians | 50.3 /100 | #173 | Average $46,440 |
| Scandinavians | 50.0 /100 | #174 | Average $46,433 |
| Basques | 48.8 /100 | #175 | Average $46,399 |
| Danes | 48.6 /100 | #176 | Average $46,392 |
| Belgians | 48.0 /100 | #177 | Average $46,375 |
| Colombians | 47.1 /100 | #178 | Average $46,349 |
| English | 46.5 /100 | #179 | Average $46,334 |
| Puget Sound Salish | 46.5 /100 | #180 | Average $46,333 |
| Immigrants | Cameroon | 46.4 /100 | #181 | Average $46,329 |
| Swiss | 45.9 /100 | #182 | Average $46,315 |
| French | 45.2 /100 | #183 | Average $46,296 |
| Immigrants | Kenya | 42.4 /100 | #184 | Average $46,214 |
| Uruguayans | 41.6 /100 | #185 | Average $46,190 |
| Vietnamese | 40.9 /100 | #186 | Average $46,172 |