Hmong vs Immigrants from Western Asia Per Capita Income
COMPARE
Hmong
Immigrants from Western Asia
Per Capita Income
Per Capita Income Comparison
Hmong
Immigrants from Western Asia
$38,120
PER CAPITA INCOME
0.2/ 100
METRIC RATING
276th/ 347
METRIC RANK
$46,876
PER CAPITA INCOME
97.4/ 100
METRIC RATING
102nd/ 347
METRIC RANK
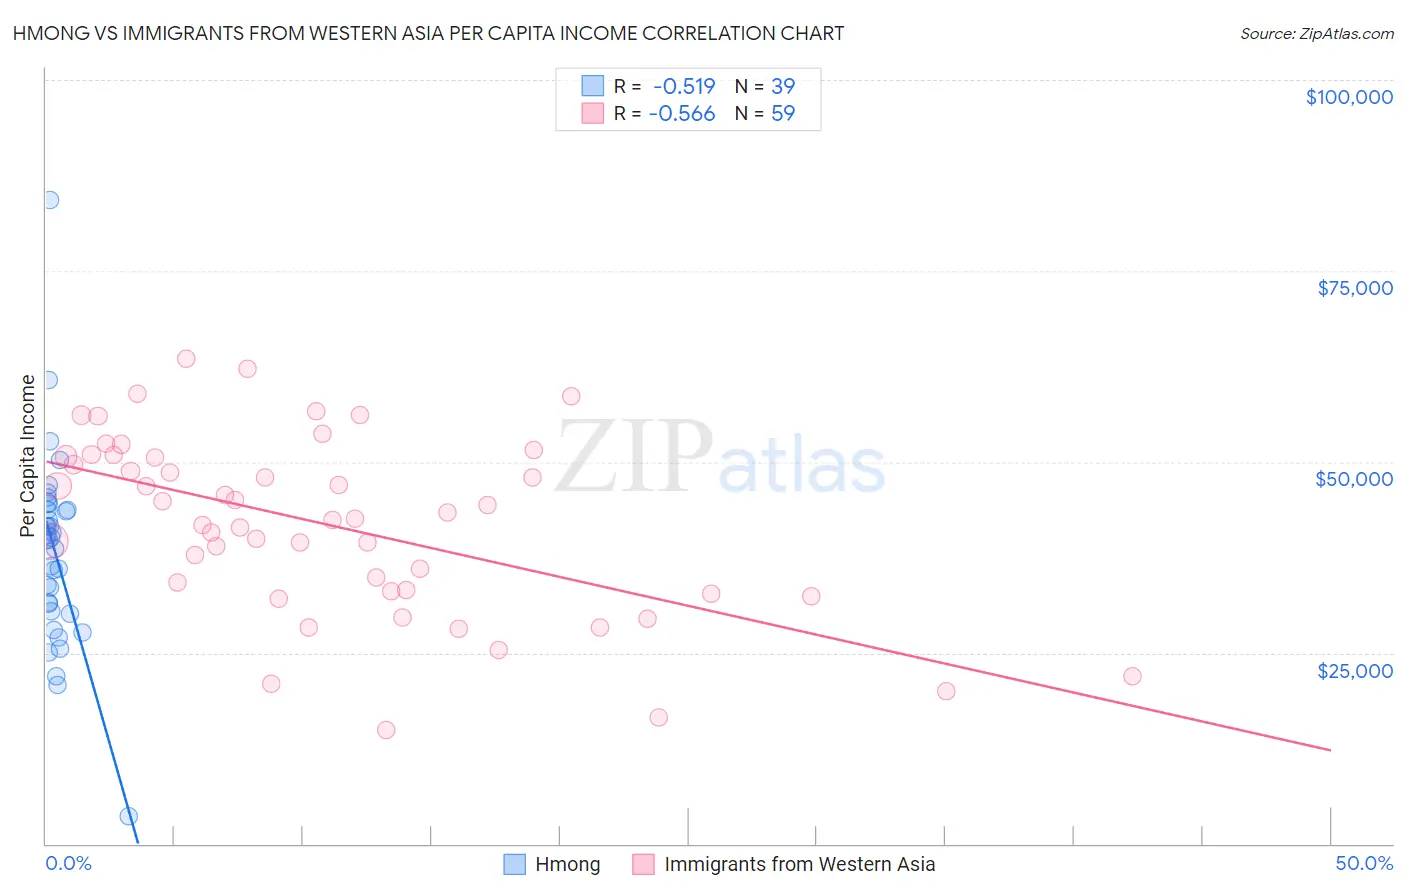
Hmong vs Immigrants from Western Asia Per Capita Income Correlation Chart
The statistical analysis conducted on geographies consisting of 24,672,334 people shows a substantial negative correlation between the proportion of Hmong and per capita income in the United States with a correlation coefficient (R) of -0.519 and weighted average of $38,120. Similarly, the statistical analysis conducted on geographies consisting of 404,456,113 people shows a substantial negative correlation between the proportion of Immigrants from Western Asia and per capita income in the United States with a correlation coefficient (R) of -0.566 and weighted average of $46,876, a difference of 23.0%.
Per Capita Income Correlation Summary
| Measurement | Hmong | Immigrants from Western Asia |
| Minimum | $3,563 | $14,820 |
| Maximum | $84,315 | $63,449 |
| Range | $80,752 | $48,629 |
| Mean | $38,244 | $41,748 |
| Median | $39,777 | $42,571 |
| Interquartile 25% (IQ1) | $30,464 | $33,011 |
| Interquartile 75% (IQ3) | $43,732 | $50,679 |
| Interquartile Range (IQR) | $13,268 | $17,668 |
| Standard Deviation (Sample) | $12,703 | $11,611 |
| Standard Deviation (Population) | $12,539 | $11,513 |
Similar Demographics by Per Capita Income
Demographics Similar to Hmong by Per Capita Income
In terms of per capita income, the demographic groups most similar to Hmong are Comanche ($38,088, a difference of 0.080%), Immigrants from Liberia ($38,165, a difference of 0.12%), Immigrants from Nicaragua ($38,065, a difference of 0.15%), Colville ($38,047, a difference of 0.19%), and Potawatomi ($38,046, a difference of 0.20%).
| Demographics | Rating | Rank | Per Capita Income |
| Immigrants | Jamaica | 0.4 /100 | #269 | Tragic $38,766 |
| Immigrants | Belize | 0.3 /100 | #270 | Tragic $38,614 |
| Central Americans | 0.3 /100 | #271 | Tragic $38,560 |
| Immigrants | Cabo Verde | 0.3 /100 | #272 | Tragic $38,540 |
| Nepalese | 0.3 /100 | #273 | Tragic $38,442 |
| Immigrants | El Salvador | 0.3 /100 | #274 | Tragic $38,394 |
| Immigrants | Liberia | 0.2 /100 | #275 | Tragic $38,165 |
| Hmong | 0.2 /100 | #276 | Tragic $38,120 |
| Comanche | 0.2 /100 | #277 | Tragic $38,088 |
| Immigrants | Nicaragua | 0.2 /100 | #278 | Tragic $38,065 |
| Colville | 0.2 /100 | #279 | Tragic $38,047 |
| Potawatomi | 0.2 /100 | #280 | Tragic $38,046 |
| Immigrants | Dominica | 0.2 /100 | #281 | Tragic $37,952 |
| Immigrants | Laos | 0.1 /100 | #282 | Tragic $37,857 |
| Pennsylvania Germans | 0.1 /100 | #283 | Tragic $37,842 |
Demographics Similar to Immigrants from Western Asia by Per Capita Income
In terms of per capita income, the demographic groups most similar to Immigrants from Western Asia are Syrian ($46,837, a difference of 0.080%), Immigrants from Uzbekistan ($46,929, a difference of 0.11%), Immigrants from Lebanon ($46,938, a difference of 0.13%), Laotian ($47,041, a difference of 0.35%), and Brazilian ($46,700, a difference of 0.38%).
| Demographics | Rating | Rank | Per Capita Income |
| Immigrants | Egypt | 98.5 /100 | #95 | Exceptional $47,361 |
| Alsatians | 98.3 /100 | #96 | Exceptional $47,284 |
| Carpatho Rusyns | 98.2 /100 | #97 | Exceptional $47,248 |
| Immigrants | Pakistan | 97.9 /100 | #98 | Exceptional $47,084 |
| Laotians | 97.8 /100 | #99 | Exceptional $47,041 |
| Immigrants | Lebanon | 97.5 /100 | #100 | Exceptional $46,938 |
| Immigrants | Uzbekistan | 97.5 /100 | #101 | Exceptional $46,929 |
| Immigrants | Western Asia | 97.4 /100 | #102 | Exceptional $46,876 |
| Syrians | 97.2 /100 | #103 | Exceptional $46,837 |
| Brazilians | 96.8 /100 | #104 | Exceptional $46,700 |
| British | 96.3 /100 | #105 | Exceptional $46,571 |
| Ethiopians | 96.3 /100 | #106 | Exceptional $46,569 |
| Serbians | 96.2 /100 | #107 | Exceptional $46,551 |
| Immigrants | Kuwait | 96.2 /100 | #108 | Exceptional $46,543 |
| Immigrants | Northern Africa | 96.2 /100 | #109 | Exceptional $46,531 |