Hmong vs Immigrants from Western Asia Professional Degree

COMPARE

Hmong
Race
Ancestry
AfghanAfricanAlaska NativeAlaskan AthabascanAlbanianAleutAlsatianAmericanApacheArabArapahoArgentineanArmenianAssyrian/Chaldean/SyriacAustralianAustrianBahamianBangladeshiBarbadianBasqueBelgianBelizeanBermudanBhutaneseBlackfeetBolivianBrazilianBritishBritish West IndianBulgarianBurmeseCajunCambodianCanadianCape VerdeanCarpatho RusynCelticCentral AmericanCentral American IndianCherokeeCheyenneChickasawChileanChineseChippewaChoctawColombianColvilleComancheCosta RicanCreeCreekCroatianCrowCubanCypriotCzechCzechoslovakianDanishDelawareDominicanDutchDutch West IndianEastern EuropeanEcuadorianEgyptianEnglishEstonianEthiopianEuropeanFijianFilipinoFinnishFrenchFrench American IndianFrench CanadianGermanGerman RussianGhanaianGreekGuamanian/ChamorroGuatemalanGuyaneseHaitianHmongHonduranHopiHoumaHungarianIcelanderIndian (Asian)IndonesianInupiatIranianIraqiIrishIroquoisIsraeliItalianJamaicanJapaneseJordanianKenyanKiowaKoreanLaotianLatvianLebaneseLiberianLithuanianLumbeeLuxembourgerMacedonianMalaysianMalteseMarshalleseMenomineeMexicanMexican American IndianMongolianMoroccanNative HawaiianNavajoNepaleseNew ZealanderNicaraguanNigerianNorthern EuropeanNorwegianOkinawanOsageOttawaPaiutePakistaniPalestinianPanamanianParaguayanPennsylvania GermanPeruvianPimaPolishPortuguesePotawatomiPuebloPuerto RicanPuget Sound SalishRomanianRussianSalvadoranSamoanScandinavianScotch-IrishScottishSeminoleSenegaleseSerbianShoshoneSierra LeoneanSiouxSlavicSlovakSloveneSomaliSouth AfricanSouth AmericanSouth American IndianSoviet UnionSpaniardSpanishSpanish AmericanSpanish American IndianSri LankanSubsaharan AfricanSudaneseSwedishSwissSyrianTaiwaneseThaiTlingit-HaidaTohono O'OdhamTonganTrinidadian and TobagonianTsimshianTurkishU.S. Virgin IslanderUgandanUkrainianUruguayanUteVenezuelanVietnameseWelshWest IndianYakamaYaquiYugoslavianYumanYup'ikZimbabwean
Immigration
NonimmigrantsImmigrantsAfghanistanAfricaAlbaniaArgentinaArmeniaAsiaAustraliaAustriaBahamasBangladeshBarbadosBelarusBelgiumBelizeBoliviaBosnia and HerzegovinaBrazilBulgariaBurma/MyanmarCabo VerdeCambodiaCameroonCanadaCaribbeanCentral AmericaChileChinaColombiaCongoCosta RicaCroatiaCubaCzechoslovakiaDenmarkDominicaDominican RepublicEastern AfricaEastern AsiaEastern EuropeEcuadorEgyptEl SalvadorEnglandEritreaEthiopiaEuropeFijiFranceGermanyGhanaGreeceGrenadaGuatemalaGuyanaHaitiHondurasHong KongHungaryIndiaIndonesiaIranIraqIrelandIsraelItalyJamaicaJapanJordanKazakhstanKenyaKoreaKuwaitLaosLatin AmericaLatviaLebanonLiberiaLithuaniaMalaysiaMexicoMicronesiaMiddle AfricaMoldovaMoroccoNepalNetherlandsNicaraguaNigeriaNorth AmericaNorth MacedoniaNorthern AfricaNorthern EuropeNorwayOceaniaPakistanPanamaPeruPhilippinesPolandPortugalRomaniaRussiaSaudi ArabiaScotlandSenegalSerbiaSierra LeoneSingaporeSomaliaSouth AfricaSouth AmericaSouth Central AsiaSouth Eastern AsiaSouthern EuropeSpainSri LankaSt. Vincent and the GrenadinesSudanSwedenSwitzerlandSyriaTaiwanThailandTrinidad and TobagoTurkeyUgandaUkraineUruguayUzbekistanVenezuelaVietnamWest IndiesWestern AfricaWestern EuropeYemenZaireZimbabweAzores
Immigrants from Western Asia
Race
Ancestry
AfghanAfricanAlaska NativeAlaskan AthabascanAlbanianAleutAlsatianAmericanApacheArabArapahoArgentineanArmenianAssyrian/Chaldean/SyriacAustralianAustrianBahamianBangladeshiBarbadianBasqueBelgianBelizeanBermudanBhutaneseBlackfeetBolivianBrazilianBritishBritish West IndianBulgarianBurmeseCajunCambodianCanadianCape VerdeanCarpatho RusynCelticCentral AmericanCentral American IndianCherokeeCheyenneChickasawChileanChineseChippewaChoctawColombianColvilleComancheCosta RicanCreeCreekCroatianCrowCubanCypriotCzechCzechoslovakianDanishDelawareDominicanDutchDutch West IndianEastern EuropeanEcuadorianEgyptianEnglishEstonianEthiopianEuropeanFijianFilipinoFinnishFrenchFrench American IndianFrench CanadianGermanGerman RussianGhanaianGreekGuamanian/ChamorroGuatemalanGuyaneseHaitianHonduranHopiHoumaHungarianIcelanderIndian (Asian)IndonesianInupiatIranianIraqiIrishIroquoisIsraeliItalianJamaicanJapaneseJordanianKenyanKiowaKoreanLaotianLatvianLebaneseLiberianLithuanianLumbeeLuxembourgerMacedonianMalaysianMalteseMarshalleseMenomineeMexicanMexican American IndianMongolianMoroccanNative HawaiianNavajoNepaleseNew ZealanderNicaraguanNigerianNorthern EuropeanNorwegianOkinawanOsageOttawaPaiutePakistaniPalestinianPanamanianParaguayanPennsylvania GermanPeruvianPimaPolishPortuguesePotawatomiPuebloPuerto RicanPuget Sound SalishRomanianRussianSalvadoranSamoanScandinavianScotch-IrishScottishSeminoleSenegaleseSerbianShoshoneSierra LeoneanSiouxSlavicSlovakSloveneSomaliSouth AfricanSouth AmericanSouth American IndianSoviet UnionSpaniardSpanishSpanish AmericanSpanish American IndianSri LankanSubsaharan AfricanSudaneseSwedishSwissSyrianTaiwaneseThaiTlingit-HaidaTohono O'OdhamTonganTrinidadian and TobagonianTsimshianTurkishU.S. Virgin IslanderUgandanUkrainianUruguayanUteVenezuelanVietnameseWelshWest IndianYakamaYaquiYugoslavianYumanYup'ikZimbabwean
Immigration
NonimmigrantsImmigrantsAfghanistanAfricaAlbaniaArgentinaArmeniaAsiaAustraliaAustriaBahamasBangladeshBarbadosBelarusBelgiumBelizeBoliviaBosnia and HerzegovinaBrazilBulgariaBurma/MyanmarCabo VerdeCambodiaCameroonCanadaCaribbeanCentral AmericaChileChinaColombiaCongoCosta RicaCroatiaCubaCzechoslovakiaDenmarkDominicaDominican RepublicEastern AfricaEastern AsiaEastern EuropeEcuadorEgyptEl SalvadorEnglandEritreaEthiopiaEuropeFijiFranceGermanyGhanaGreeceGrenadaGuatemalaGuyanaHaitiHondurasHong KongHungaryIndiaIndonesiaIranIraqIrelandIsraelItalyJamaicaJapanJordanKazakhstanKenyaKoreaKuwaitLaosLatin AmericaLatviaLebanonLiberiaLithuaniaMalaysiaMexicoMicronesiaMiddle AfricaMoldovaMoroccoNepalNetherlandsNicaraguaNigeriaNorth AmericaNorth MacedoniaNorthern AfricaNorthern EuropeNorwayOceaniaPakistanPanamaPeruPhilippinesPolandPortugalRomaniaRussiaSaudi ArabiaScotlandSenegalSerbiaSierra LeoneSingaporeSomaliaSouth AfricaSouth AmericaSouth Central AsiaSouth Eastern AsiaSouthern EuropeSpainSri LankaSt. Vincent and the GrenadinesSudanSwedenSwitzerlandSyriaTaiwanThailandTrinidad and TobagoTurkeyUgandaUkraineUruguayUzbekistanVenezuelaVietnamWest IndiesWestern AfricaWestern AsiaWestern EuropeYemenZaireZimbabweAzores
Professional Degree
Income
Poverty
Unemployment
Labor Participation
Family Structure
Vehicle Availability
Education Level
Disability

Professional Degree Comparison

Hmong

Immigrants from Western Asia

Tragic
Exceptional
3.7%
PROFESSIONAL DEGREE
1.6/ 100
METRIC RATING
248th/ 347
METRIC RANK
5.4%
PROFESSIONAL DEGREE
99.8/ 100
METRIC RATING
71st/ 347
METRIC RANK

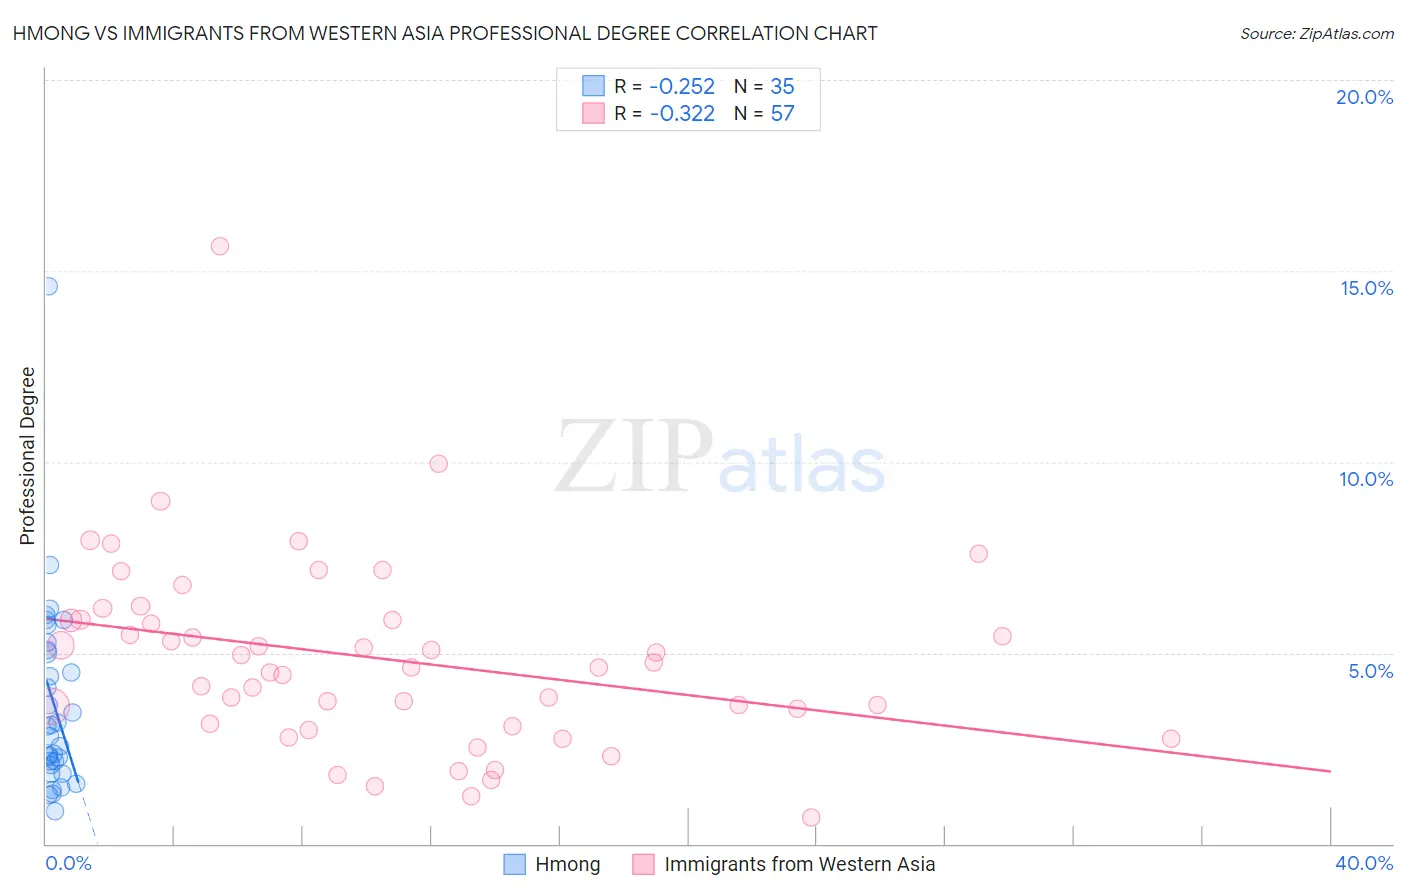
Hmong vs Immigrants from Western Asia Professional Degree Correlation Chart

The statistical analysis conducted on geographies consisting of 24,646,446 people shows a weak negative correlation between the proportion of Hmong and percentage of population with at least professional degree education in the United States with a correlation coefficient (R) of -0.252 and weighted average of 3.7%. Similarly, the statistical analysis conducted on geographies consisting of 403,868,924 people shows a mild negative correlation between the proportion of Immigrants from Western Asia and percentage of population with at least professional degree education in the United States with a correlation coefficient (R) of -0.322 and weighted average of 5.4%, a difference of 44.4%.
Hmong vs Immigrants from Western Asia Professional Degree

Professional Degree Correlation Summary

MeasurementHmongImmigrants from Western Asia
Minimum0.86%0.70%
Maximum14.6%15.7%
Range13.7%14.9%
Mean3.7%4.8%
Median3.1%4.6%
Interquartile 25% (IQ1)2.0%3.1%
Interquartile 75% (IQ3)5.1%5.9%
Interquartile Range (IQR)3.0%2.8%
Standard Deviation (Sample)2.6%2.5%
Standard Deviation (Population)2.5%2.5%

Similar Demographics by Professional Degree

Demographics Similar to Hmong by Professional Degree

In terms of professional degree, the demographic groups most similar to Hmong are Immigrants from Grenada (3.7%, a difference of 0.11%), Guyanese (3.8%, a difference of 0.16%), Marshallese (3.8%, a difference of 0.18%), Immigrants from Fiji (3.7%, a difference of 0.18%), and French American Indian (3.8%, a difference of 0.36%).
DemographicsRating | RankProfessional Degree
Alaskan Athabascans
2.3
/100
|
#241
Tragic
3.8%
Native Hawaiians
2.3
/100
|
#242
Tragic
3.8%
Guamanians/Chamorros
2.2
/100
|
#243
Tragic
3.8%
Immigrants | Bahamas
2.0
/100
|
#244
Tragic
3.8%
French American Indians
1.7
/100
|
#245
Tragic
3.8%
Marshallese
1.7
/100
|
#246
Tragic
3.8%
Guyanese
1.6
/100
|
#247
Tragic
3.8%
Hmong
1.6
/100
|
#248
Tragic
3.7%
Immigrants | Grenada
1.5
/100
|
#249
Tragic
3.7%
Immigrants | Fiji
1.5
/100
|
#250
Tragic
3.7%
Immigrants | Nicaragua
1.4
/100
|
#251
Tragic
3.7%
Jamaicans
1.4
/100
|
#252
Tragic
3.7%
Pueblo
1.4
/100
|
#253
Tragic
3.7%
Tongans
1.3
/100
|
#254
Tragic
3.7%
Osage
1.2
/100
|
#255
Tragic
3.7%

Demographics Similar to Immigrants from Western Asia by Professional Degree

In terms of professional degree, the demographic groups most similar to Immigrants from Western Asia are Lithuanian (5.4%, a difference of 0.48%), Immigrants from Romania (5.4%, a difference of 0.58%), Bhutanese (5.4%, a difference of 0.59%), Immigrants from Hungary (5.5%, a difference of 0.92%), and Ethiopian (5.4%, a difference of 0.96%).
DemographicsRating | RankProfessional Degree
Immigrants | Asia
99.9
/100
|
#64
Exceptional
5.5%
Immigrants | Bolivia
99.9
/100
|
#65
Exceptional
5.5%
Immigrants | Kazakhstan
99.9
/100
|
#66
Exceptional
5.5%
Immigrants | Bulgaria
99.9
/100
|
#67
Exceptional
5.5%
Immigrants | Lebanon
99.9
/100
|
#68
Exceptional
5.5%
Immigrants | Hungary
99.9
/100
|
#69
Exceptional
5.5%
Bhutanese
99.8
/100
|
#70
Exceptional
5.4%
Immigrants | Western Asia
99.8
/100
|
#71
Exceptional
5.4%
Lithuanians
99.8
/100
|
#72
Exceptional
5.4%
Immigrants | Romania
99.8
/100
|
#73
Exceptional
5.4%
Ethiopians
99.7
/100
|
#74
Exceptional
5.4%
Immigrants | Indonesia
99.7
/100
|
#75
Exceptional
5.3%
Immigrants | Canada
99.7
/100
|
#76
Exceptional
5.3%
Immigrants | Ethiopia
99.7
/100
|
#77
Exceptional
5.3%
Armenians
99.7
/100
|
#78
Exceptional
5.3%