Hmong vs Nonimmigrants Per Capita Income
COMPARE
Hmong
Nonimmigrants
Per Capita Income
Per Capita Income Comparison
Hmong
Nonimmigrants
$38,120
PER CAPITA INCOME
0.2/ 100
METRIC RATING
276th/ 347
METRIC RANK
$40,669
PER CAPITA INCOME
3.4/ 100
METRIC RATING
236th/ 347
METRIC RANK
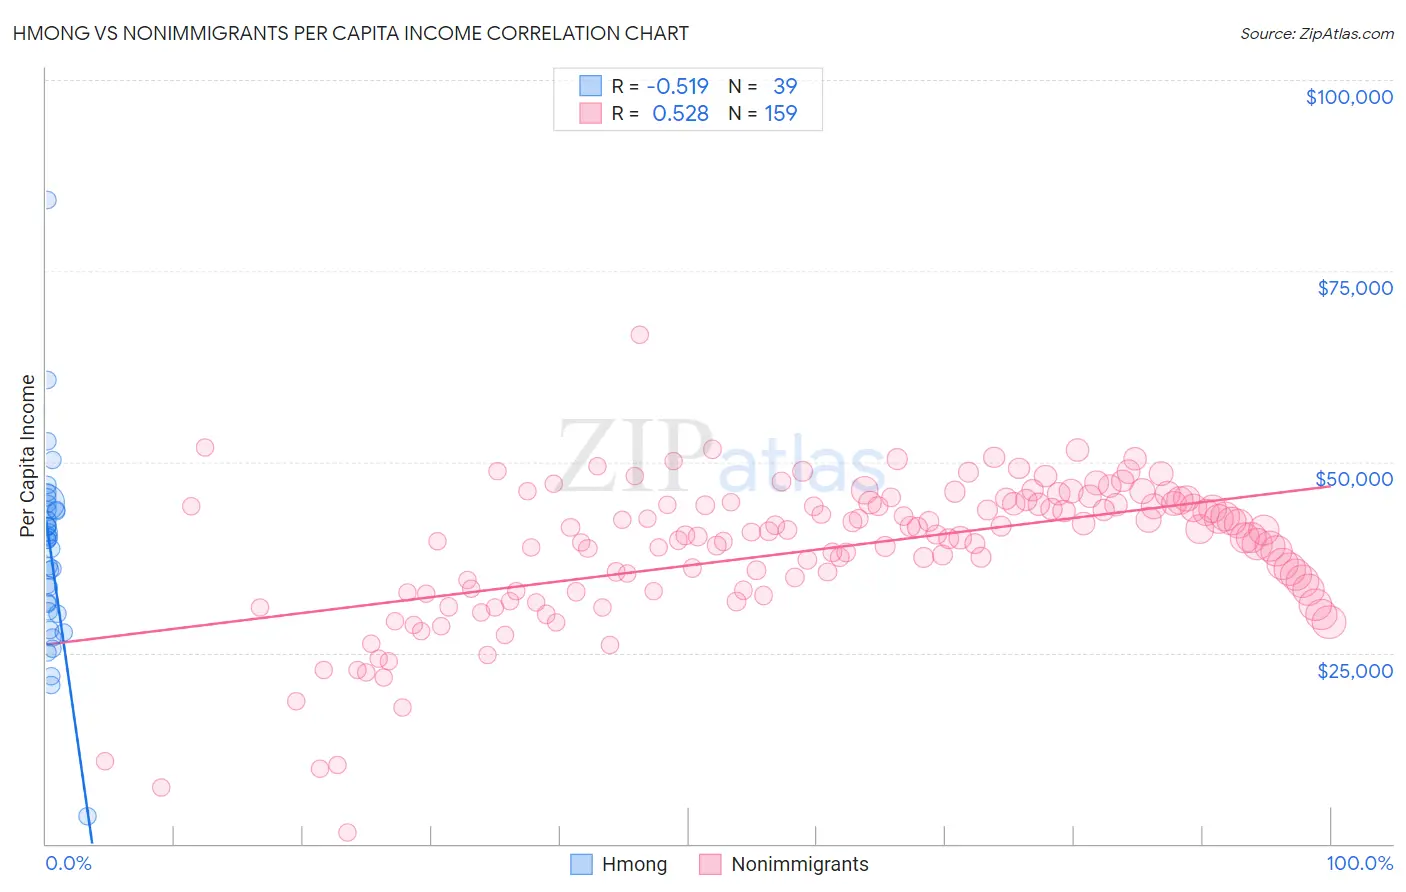
Hmong vs Nonimmigrants Per Capita Income Correlation Chart
The statistical analysis conducted on geographies consisting of 24,672,334 people shows a substantial negative correlation between the proportion of Hmong and per capita income in the United States with a correlation coefficient (R) of -0.519 and weighted average of $38,120. Similarly, the statistical analysis conducted on geographies consisting of 585,383,873 people shows a substantial positive correlation between the proportion of Nonimmigrants and per capita income in the United States with a correlation coefficient (R) of 0.528 and weighted average of $40,669, a difference of 6.7%.
Per Capita Income Correlation Summary
| Measurement | Hmong | Nonimmigrants |
| Minimum | $3,563 | $1,397 |
| Maximum | $84,315 | $66,659 |
| Range | $80,752 | $65,262 |
| Mean | $38,244 | $38,443 |
| Median | $39,777 | $40,388 |
| Interquartile 25% (IQ1) | $30,464 | $33,053 |
| Interquartile 75% (IQ3) | $43,732 | $44,574 |
| Interquartile Range (IQR) | $13,268 | $11,521 |
| Standard Deviation (Sample) | $12,703 | $9,433 |
| Standard Deviation (Population) | $12,539 | $9,403 |
Similar Demographics by Per Capita Income
Demographics Similar to Hmong by Per Capita Income
In terms of per capita income, the demographic groups most similar to Hmong are Comanche ($38,088, a difference of 0.080%), Immigrants from Liberia ($38,165, a difference of 0.12%), Immigrants from Nicaragua ($38,065, a difference of 0.15%), Colville ($38,047, a difference of 0.19%), and Potawatomi ($38,046, a difference of 0.20%).
| Demographics | Rating | Rank | Per Capita Income |
| Immigrants | Jamaica | 0.4 /100 | #269 | Tragic $38,766 |
| Immigrants | Belize | 0.3 /100 | #270 | Tragic $38,614 |
| Central Americans | 0.3 /100 | #271 | Tragic $38,560 |
| Immigrants | Cabo Verde | 0.3 /100 | #272 | Tragic $38,540 |
| Nepalese | 0.3 /100 | #273 | Tragic $38,442 |
| Immigrants | El Salvador | 0.3 /100 | #274 | Tragic $38,394 |
| Immigrants | Liberia | 0.2 /100 | #275 | Tragic $38,165 |
| Hmong | 0.2 /100 | #276 | Tragic $38,120 |
| Comanche | 0.2 /100 | #277 | Tragic $38,088 |
| Immigrants | Nicaragua | 0.2 /100 | #278 | Tragic $38,065 |
| Colville | 0.2 /100 | #279 | Tragic $38,047 |
| Potawatomi | 0.2 /100 | #280 | Tragic $38,046 |
| Immigrants | Dominica | 0.2 /100 | #281 | Tragic $37,952 |
| Immigrants | Laos | 0.1 /100 | #282 | Tragic $37,857 |
| Pennsylvania Germans | 0.1 /100 | #283 | Tragic $37,842 |
Demographics Similar to Nonimmigrants by Per Capita Income
In terms of per capita income, the demographic groups most similar to Nonimmigrants are Immigrants from Guyana ($40,742, a difference of 0.18%), Immigrants from West Indies ($40,763, a difference of 0.23%), Delaware ($40,778, a difference of 0.27%), Immigrants from Cambodia ($40,434, a difference of 0.58%), and Guyanese ($40,949, a difference of 0.69%).
| Demographics | Rating | Rank | Per Capita Income |
| Nigerians | 4.9 /100 | #229 | Tragic $41,026 |
| Native Hawaiians | 4.9 /100 | #230 | Tragic $41,017 |
| Senegalese | 4.8 /100 | #231 | Tragic $41,000 |
| Guyanese | 4.5 /100 | #232 | Tragic $40,949 |
| Delaware | 3.8 /100 | #233 | Tragic $40,778 |
| Immigrants | West Indies | 3.7 /100 | #234 | Tragic $40,763 |
| Immigrants | Guyana | 3.6 /100 | #235 | Tragic $40,742 |
| Immigrants | Nonimmigrants | 3.4 /100 | #236 | Tragic $40,669 |
| Immigrants | Cambodia | 2.6 /100 | #237 | Tragic $40,434 |
| Somalis | 2.4 /100 | #238 | Tragic $40,367 |
| Tsimshian | 2.4 /100 | #239 | Tragic $40,344 |
| Immigrants | Nigeria | 2.3 /100 | #240 | Tragic $40,339 |
| British West Indians | 2.3 /100 | #241 | Tragic $40,330 |
| Immigrants | Western Africa | 2.2 /100 | #242 | Tragic $40,294 |
| German Russians | 2.2 /100 | #243 | Tragic $40,266 |