Guyanese vs Immigrants from Western Asia Per Capita Income
COMPARE
Guyanese
Immigrants from Western Asia
Per Capita Income
Per Capita Income Comparison
Guyanese
Immigrants from Western Asia
$40,949
PER CAPITA INCOME
4.5/ 100
METRIC RATING
232nd/ 347
METRIC RANK
$46,876
PER CAPITA INCOME
97.4/ 100
METRIC RATING
102nd/ 347
METRIC RANK
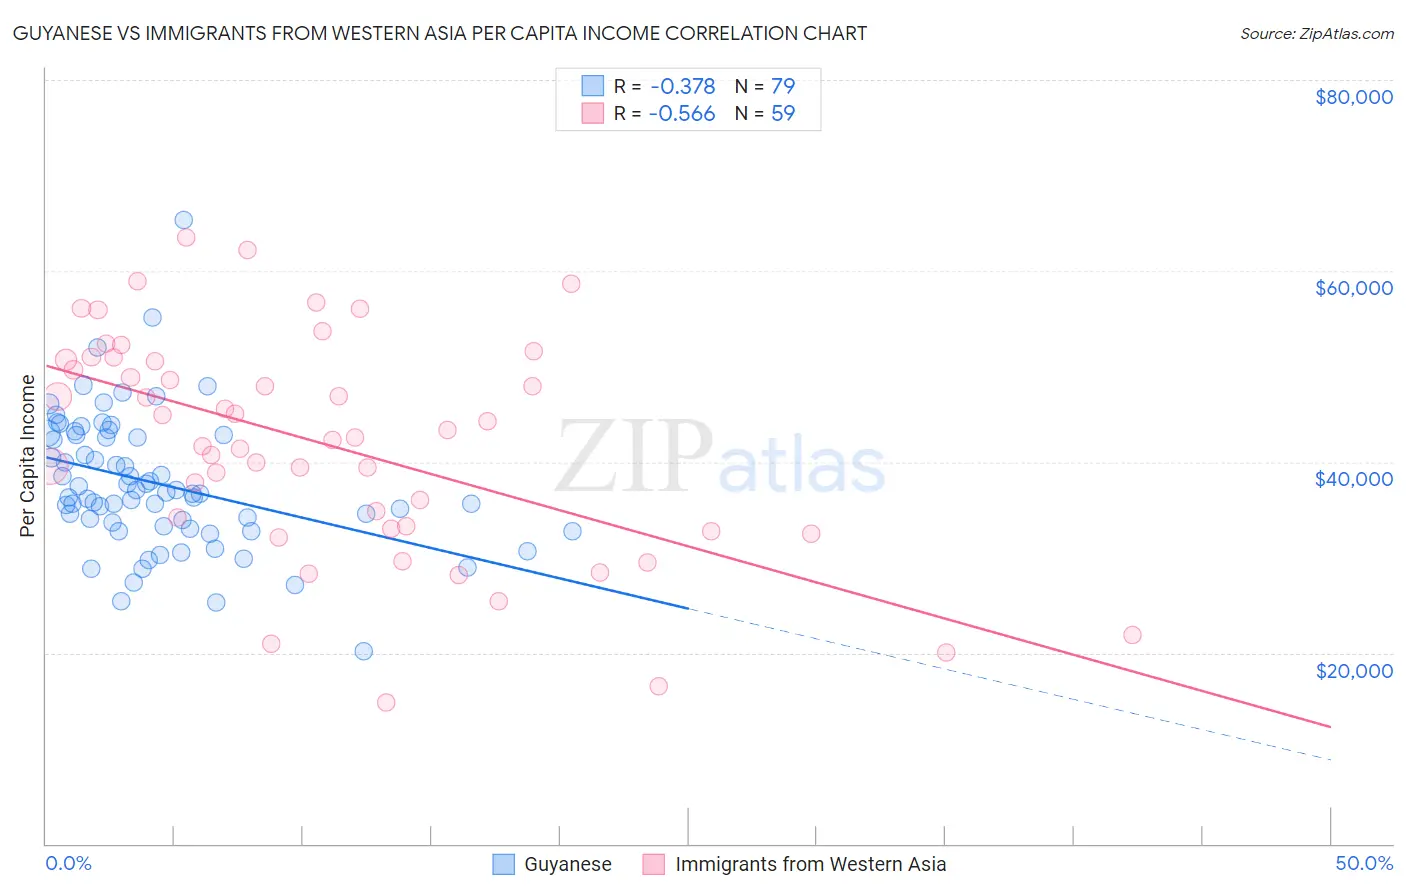
Guyanese vs Immigrants from Western Asia Per Capita Income Correlation Chart
The statistical analysis conducted on geographies consisting of 176,945,802 people shows a mild negative correlation between the proportion of Guyanese and per capita income in the United States with a correlation coefficient (R) of -0.378 and weighted average of $40,949. Similarly, the statistical analysis conducted on geographies consisting of 404,456,113 people shows a substantial negative correlation between the proportion of Immigrants from Western Asia and per capita income in the United States with a correlation coefficient (R) of -0.566 and weighted average of $46,876, a difference of 14.5%.
Per Capita Income Correlation Summary
| Measurement | Guyanese | Immigrants from Western Asia |
| Minimum | $20,131 | $14,820 |
| Maximum | $65,314 | $63,449 |
| Range | $45,183 | $48,629 |
| Mean | $37,694 | $41,748 |
| Median | $36,719 | $42,571 |
| Interquartile 25% (IQ1) | $33,285 | $33,011 |
| Interquartile 75% (IQ3) | $42,829 | $50,679 |
| Interquartile Range (IQR) | $9,544 | $17,668 |
| Standard Deviation (Sample) | $7,132 | $11,611 |
| Standard Deviation (Population) | $7,087 | $11,513 |
Similar Demographics by Per Capita Income
Demographics Similar to Guyanese by Per Capita Income
In terms of per capita income, the demographic groups most similar to Guyanese are Senegalese ($41,000, a difference of 0.12%), Native Hawaiian ($41,017, a difference of 0.16%), Nigerian ($41,026, a difference of 0.19%), Immigrants from Grenada ($41,123, a difference of 0.42%), and Delaware ($40,778, a difference of 0.42%).
| Demographics | Rating | Rank | Per Capita Income |
| West Indians | 6.0 /100 | #225 | Tragic $41,217 |
| Immigrants | Ecuador | 5.9 /100 | #226 | Tragic $41,195 |
| Immigrants | Ghana | 5.5 /100 | #227 | Tragic $41,131 |
| Immigrants | Grenada | 5.5 /100 | #228 | Tragic $41,123 |
| Nigerians | 4.9 /100 | #229 | Tragic $41,026 |
| Native Hawaiians | 4.9 /100 | #230 | Tragic $41,017 |
| Senegalese | 4.8 /100 | #231 | Tragic $41,000 |
| Guyanese | 4.5 /100 | #232 | Tragic $40,949 |
| Delaware | 3.8 /100 | #233 | Tragic $40,778 |
| Immigrants | West Indies | 3.7 /100 | #234 | Tragic $40,763 |
| Immigrants | Guyana | 3.6 /100 | #235 | Tragic $40,742 |
| Immigrants | Nonimmigrants | 3.4 /100 | #236 | Tragic $40,669 |
| Immigrants | Cambodia | 2.6 /100 | #237 | Tragic $40,434 |
| Somalis | 2.4 /100 | #238 | Tragic $40,367 |
| Tsimshian | 2.4 /100 | #239 | Tragic $40,344 |
Demographics Similar to Immigrants from Western Asia by Per Capita Income
In terms of per capita income, the demographic groups most similar to Immigrants from Western Asia are Syrian ($46,837, a difference of 0.080%), Immigrants from Uzbekistan ($46,929, a difference of 0.11%), Immigrants from Lebanon ($46,938, a difference of 0.13%), Laotian ($47,041, a difference of 0.35%), and Brazilian ($46,700, a difference of 0.38%).
| Demographics | Rating | Rank | Per Capita Income |
| Immigrants | Egypt | 98.5 /100 | #95 | Exceptional $47,361 |
| Alsatians | 98.3 /100 | #96 | Exceptional $47,284 |
| Carpatho Rusyns | 98.2 /100 | #97 | Exceptional $47,248 |
| Immigrants | Pakistan | 97.9 /100 | #98 | Exceptional $47,084 |
| Laotians | 97.8 /100 | #99 | Exceptional $47,041 |
| Immigrants | Lebanon | 97.5 /100 | #100 | Exceptional $46,938 |
| Immigrants | Uzbekistan | 97.5 /100 | #101 | Exceptional $46,929 |
| Immigrants | Western Asia | 97.4 /100 | #102 | Exceptional $46,876 |
| Syrians | 97.2 /100 | #103 | Exceptional $46,837 |
| Brazilians | 96.8 /100 | #104 | Exceptional $46,700 |
| British | 96.3 /100 | #105 | Exceptional $46,571 |
| Ethiopians | 96.3 /100 | #106 | Exceptional $46,569 |
| Serbians | 96.2 /100 | #107 | Exceptional $46,551 |
| Immigrants | Kuwait | 96.2 /100 | #108 | Exceptional $46,543 |
| Immigrants | Northern Africa | 96.2 /100 | #109 | Exceptional $46,531 |