Creek vs Immigrants from Western Asia Per Capita Income
COMPARE
Creek
Immigrants from Western Asia
Per Capita Income
Per Capita Income Comparison
Creek
Immigrants from Western Asia
$35,546
PER CAPITA INCOME
0.0/ 100
METRIC RATING
322nd/ 347
METRIC RANK
$46,876
PER CAPITA INCOME
97.4/ 100
METRIC RATING
102nd/ 347
METRIC RANK
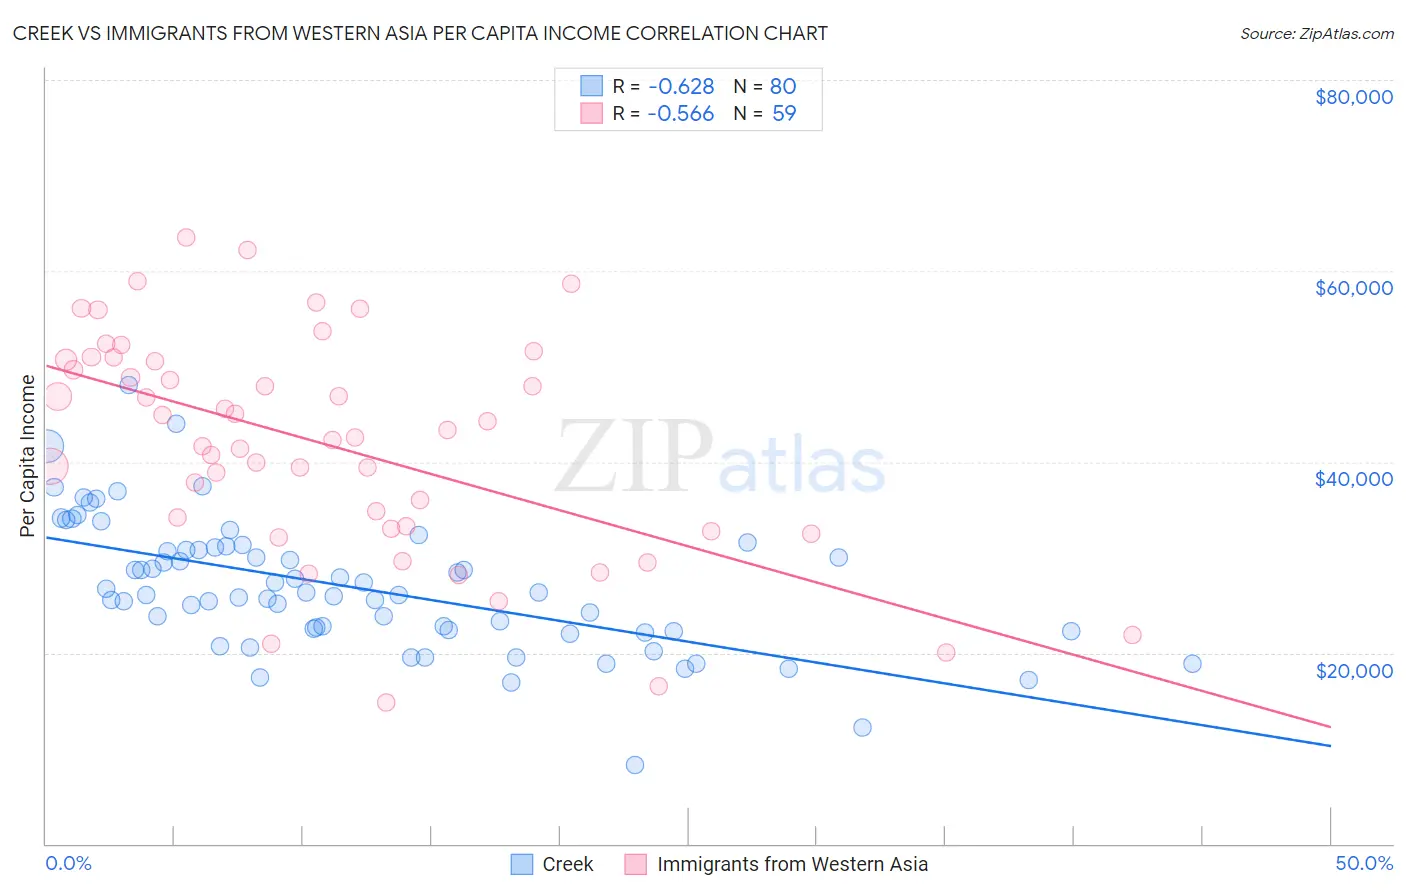
Creek vs Immigrants from Western Asia Per Capita Income Correlation Chart
The statistical analysis conducted on geographies consisting of 178,484,884 people shows a significant negative correlation between the proportion of Creek and per capita income in the United States with a correlation coefficient (R) of -0.628 and weighted average of $35,546. Similarly, the statistical analysis conducted on geographies consisting of 404,456,113 people shows a substantial negative correlation between the proportion of Immigrants from Western Asia and per capita income in the United States with a correlation coefficient (R) of -0.566 and weighted average of $46,876, a difference of 31.9%.
Per Capita Income Correlation Summary
| Measurement | Creek | Immigrants from Western Asia |
| Minimum | $8,185 | $14,820 |
| Maximum | $48,038 | $63,449 |
| Range | $39,853 | $48,629 |
| Mean | $26,882 | $41,748 |
| Median | $26,137 | $42,571 |
| Interquartile 25% (IQ1) | $22,339 | $33,011 |
| Interquartile 75% (IQ3) | $30,941 | $50,679 |
| Interquartile Range (IQR) | $8,603 | $17,668 |
| Standard Deviation (Sample) | $6,895 | $11,611 |
| Standard Deviation (Population) | $6,852 | $11,513 |
Similar Demographics by Per Capita Income
Demographics Similar to Creek by Per Capita Income
In terms of per capita income, the demographic groups most similar to Creek are Black/African American ($35,564, a difference of 0.050%), Hispanic or Latino ($35,688, a difference of 0.40%), Immigrants from Congo ($35,720, a difference of 0.49%), Cheyenne ($35,276, a difference of 0.76%), and Bangladeshi ($35,897, a difference of 0.99%).
| Demographics | Rating | Rank | Per Capita Income |
| Yaqui | 0.0 /100 | #315 | Tragic $36,112 |
| Choctaw | 0.0 /100 | #316 | Tragic $35,999 |
| Dutch West Indians | 0.0 /100 | #317 | Tragic $35,922 |
| Bangladeshis | 0.0 /100 | #318 | Tragic $35,897 |
| Immigrants | Congo | 0.0 /100 | #319 | Tragic $35,720 |
| Hispanics or Latinos | 0.0 /100 | #320 | Tragic $35,688 |
| Blacks/African Americans | 0.0 /100 | #321 | Tragic $35,564 |
| Creek | 0.0 /100 | #322 | Tragic $35,546 |
| Cheyenne | 0.0 /100 | #323 | Tragic $35,276 |
| Kiowa | 0.0 /100 | #324 | Tragic $35,102 |
| Immigrants | Central America | 0.0 /100 | #325 | Tragic $34,974 |
| Immigrants | Cuba | 0.0 /100 | #326 | Tragic $34,910 |
| Apache | 0.0 /100 | #327 | Tragic $34,886 |
| Menominee | 0.0 /100 | #328 | Tragic $34,578 |
| Mexicans | 0.0 /100 | #329 | Tragic $34,559 |
Demographics Similar to Immigrants from Western Asia by Per Capita Income
In terms of per capita income, the demographic groups most similar to Immigrants from Western Asia are Syrian ($46,837, a difference of 0.080%), Immigrants from Uzbekistan ($46,929, a difference of 0.11%), Immigrants from Lebanon ($46,938, a difference of 0.13%), Laotian ($47,041, a difference of 0.35%), and Brazilian ($46,700, a difference of 0.38%).
| Demographics | Rating | Rank | Per Capita Income |
| Immigrants | Egypt | 98.5 /100 | #95 | Exceptional $47,361 |
| Alsatians | 98.3 /100 | #96 | Exceptional $47,284 |
| Carpatho Rusyns | 98.2 /100 | #97 | Exceptional $47,248 |
| Immigrants | Pakistan | 97.9 /100 | #98 | Exceptional $47,084 |
| Laotians | 97.8 /100 | #99 | Exceptional $47,041 |
| Immigrants | Lebanon | 97.5 /100 | #100 | Exceptional $46,938 |
| Immigrants | Uzbekistan | 97.5 /100 | #101 | Exceptional $46,929 |
| Immigrants | Western Asia | 97.4 /100 | #102 | Exceptional $46,876 |
| Syrians | 97.2 /100 | #103 | Exceptional $46,837 |
| Brazilians | 96.8 /100 | #104 | Exceptional $46,700 |
| British | 96.3 /100 | #105 | Exceptional $46,571 |
| Ethiopians | 96.3 /100 | #106 | Exceptional $46,569 |
| Serbians | 96.2 /100 | #107 | Exceptional $46,551 |
| Immigrants | Kuwait | 96.2 /100 | #108 | Exceptional $46,543 |
| Immigrants | Northern Africa | 96.2 /100 | #109 | Exceptional $46,531 |