Hmong vs Immigrants from Turkey Per Capita Income

COMPARE

Hmong
Race
Ancestry
AfghanAfricanAlaska NativeAlaskan AthabascanAlbanianAleutAlsatianAmericanApacheArabArapahoArgentineanArmenianAssyrian/Chaldean/SyriacAustralianAustrianBahamianBangladeshiBarbadianBasqueBelgianBelizeanBermudanBhutaneseBlackfeetBolivianBrazilianBritishBritish West IndianBulgarianBurmeseCajunCambodianCanadianCape VerdeanCarpatho RusynCelticCentral AmericanCentral American IndianCherokeeCheyenneChickasawChileanChineseChippewaChoctawColombianColvilleComancheCosta RicanCreeCreekCroatianCrowCubanCypriotCzechCzechoslovakianDanishDelawareDominicanDutchDutch West IndianEastern EuropeanEcuadorianEgyptianEnglishEstonianEthiopianEuropeanFijianFilipinoFinnishFrenchFrench American IndianFrench CanadianGermanGerman RussianGhanaianGreekGuamanian/ChamorroGuatemalanGuyaneseHaitianHmongHonduranHopiHoumaHungarianIcelanderIndian (Asian)IndonesianInupiatIranianIraqiIrishIroquoisIsraeliItalianJamaicanJapaneseJordanianKenyanKiowaKoreanLaotianLatvianLebaneseLiberianLithuanianLumbeeLuxembourgerMacedonianMalaysianMalteseMarshalleseMenomineeMexicanMexican American IndianMongolianMoroccanNative HawaiianNavajoNepaleseNew ZealanderNicaraguanNigerianNorthern EuropeanNorwegianOkinawanOsageOttawaPaiutePakistaniPalestinianPanamanianParaguayanPennsylvania GermanPeruvianPimaPolishPortuguesePotawatomiPuebloPuerto RicanPuget Sound SalishRomanianRussianSalvadoranSamoanScandinavianScotch-IrishScottishSeminoleSenegaleseSerbianShoshoneSierra LeoneanSiouxSlavicSlovakSloveneSomaliSouth AfricanSouth AmericanSouth American IndianSoviet UnionSpaniardSpanishSpanish AmericanSpanish American IndianSri LankanSubsaharan AfricanSudaneseSwedishSwissSyrianTaiwaneseThaiTlingit-HaidaTohono O'OdhamTonganTrinidadian and TobagonianTsimshianTurkishU.S. Virgin IslanderUgandanUkrainianUruguayanUteVenezuelanVietnameseWelshWest IndianYakamaYaquiYugoslavianYumanYup'ikZimbabwean
Immigration
NonimmigrantsImmigrantsAfghanistanAfricaAlbaniaArgentinaArmeniaAsiaAustraliaAustriaBahamasBangladeshBarbadosBelarusBelgiumBelizeBoliviaBosnia and HerzegovinaBrazilBulgariaBurma/MyanmarCabo VerdeCambodiaCameroonCanadaCaribbeanCentral AmericaChileChinaColombiaCongoCosta RicaCroatiaCubaCzechoslovakiaDenmarkDominicaDominican RepublicEastern AfricaEastern AsiaEastern EuropeEcuadorEgyptEl SalvadorEnglandEritreaEthiopiaEuropeFijiFranceGermanyGhanaGreeceGrenadaGuatemalaGuyanaHaitiHondurasHong KongHungaryIndiaIndonesiaIranIraqIrelandIsraelItalyJamaicaJapanJordanKazakhstanKenyaKoreaKuwaitLaosLatin AmericaLatviaLebanonLiberiaLithuaniaMalaysiaMexicoMicronesiaMiddle AfricaMoldovaMoroccoNepalNetherlandsNicaraguaNigeriaNorth AmericaNorth MacedoniaNorthern AfricaNorthern EuropeNorwayOceaniaPakistanPanamaPeruPhilippinesPolandPortugalRomaniaRussiaSaudi ArabiaScotlandSenegalSerbiaSierra LeoneSingaporeSomaliaSouth AfricaSouth AmericaSouth Central AsiaSouth Eastern AsiaSouthern EuropeSpainSri LankaSt. Vincent and the GrenadinesSudanSwedenSwitzerlandSyriaTaiwanThailandTrinidad and TobagoUgandaUkraineUruguayUzbekistanVenezuelaVietnamWest IndiesWestern AfricaWestern AsiaWestern EuropeYemenZaireZimbabweAzores
Immigrants from Turkey
Race
Ancestry
AfghanAfricanAlaska NativeAlaskan AthabascanAlbanianAleutAlsatianAmericanApacheArabArapahoArgentineanArmenianAssyrian/Chaldean/SyriacAustralianAustrianBahamianBangladeshiBarbadianBasqueBelgianBelizeanBermudanBhutaneseBlackfeetBolivianBrazilianBritishBritish West IndianBulgarianBurmeseCajunCambodianCanadianCape VerdeanCarpatho RusynCelticCentral AmericanCentral American IndianCherokeeCheyenneChickasawChileanChineseChippewaChoctawColombianColvilleComancheCosta RicanCreeCreekCroatianCrowCubanCypriotCzechCzechoslovakianDanishDelawareDominicanDutchDutch West IndianEastern EuropeanEcuadorianEgyptianEnglishEstonianEthiopianEuropeanFijianFilipinoFinnishFrenchFrench American IndianFrench CanadianGermanGerman RussianGhanaianGreekGuamanian/ChamorroGuatemalanGuyaneseHaitianHonduranHopiHoumaHungarianIcelanderIndian (Asian)IndonesianInupiatIranianIraqiIrishIroquoisIsraeliItalianJamaicanJapaneseJordanianKenyanKiowaKoreanLaotianLatvianLebaneseLiberianLithuanianLumbeeLuxembourgerMacedonianMalaysianMalteseMarshalleseMenomineeMexicanMexican American IndianMongolianMoroccanNative HawaiianNavajoNepaleseNew ZealanderNicaraguanNigerianNorthern EuropeanNorwegianOkinawanOsageOttawaPaiutePakistaniPalestinianPanamanianParaguayanPennsylvania GermanPeruvianPimaPolishPortuguesePotawatomiPuebloPuerto RicanPuget Sound SalishRomanianRussianSalvadoranSamoanScandinavianScotch-IrishScottishSeminoleSenegaleseSerbianShoshoneSierra LeoneanSiouxSlavicSlovakSloveneSomaliSouth AfricanSouth AmericanSouth American IndianSoviet UnionSpaniardSpanishSpanish AmericanSpanish American IndianSri LankanSubsaharan AfricanSudaneseSwedishSwissSyrianTaiwaneseThaiTlingit-HaidaTohono O'OdhamTonganTrinidadian and TobagonianTsimshianTurkishU.S. Virgin IslanderUgandanUkrainianUruguayanUteVenezuelanVietnameseWelshWest IndianYakamaYaquiYugoslavianYumanYup'ikZimbabwean
Immigration
NonimmigrantsImmigrantsAfghanistanAfricaAlbaniaArgentinaArmeniaAsiaAustraliaAustriaBahamasBangladeshBarbadosBelarusBelgiumBelizeBoliviaBosnia and HerzegovinaBrazilBulgariaBurma/MyanmarCabo VerdeCambodiaCameroonCanadaCaribbeanCentral AmericaChileChinaColombiaCongoCosta RicaCroatiaCubaCzechoslovakiaDenmarkDominicaDominican RepublicEastern AfricaEastern AsiaEastern EuropeEcuadorEgyptEl SalvadorEnglandEritreaEthiopiaEuropeFijiFranceGermanyGhanaGreeceGrenadaGuatemalaGuyanaHaitiHondurasHong KongHungaryIndiaIndonesiaIranIraqIrelandIsraelItalyJamaicaJapanJordanKazakhstanKenyaKoreaKuwaitLaosLatin AmericaLatviaLebanonLiberiaLithuaniaMalaysiaMexicoMicronesiaMiddle AfricaMoldovaMoroccoNepalNetherlandsNicaraguaNigeriaNorth AmericaNorth MacedoniaNorthern AfricaNorthern EuropeNorwayOceaniaPakistanPanamaPeruPhilippinesPolandPortugalRomaniaRussiaSaudi ArabiaScotlandSenegalSerbiaSierra LeoneSingaporeSomaliaSouth AfricaSouth AmericaSouth Central AsiaSouth Eastern AsiaSouthern EuropeSpainSri LankaSt. Vincent and the GrenadinesSudanSwedenSwitzerlandSyriaTaiwanThailandTrinidad and TobagoTurkeyUgandaUkraineUruguayUzbekistanVenezuelaVietnamWest IndiesWestern AfricaWestern AsiaWestern EuropeYemenZaireZimbabweAzores
Per Capita Income
Income
Poverty
Unemployment
Labor Participation
Family Structure
Vehicle Availability
Education Level
Disability

Per Capita Income Comparison

Hmong

Immigrants from Turkey

Tragic
Exceptional
$38,120
PER CAPITA INCOME
0.2/ 100
METRIC RATING
276th/ 347
METRIC RANK
$51,368
PER CAPITA INCOME
100.0/ 100
METRIC RATING
42nd/ 347
METRIC RANK

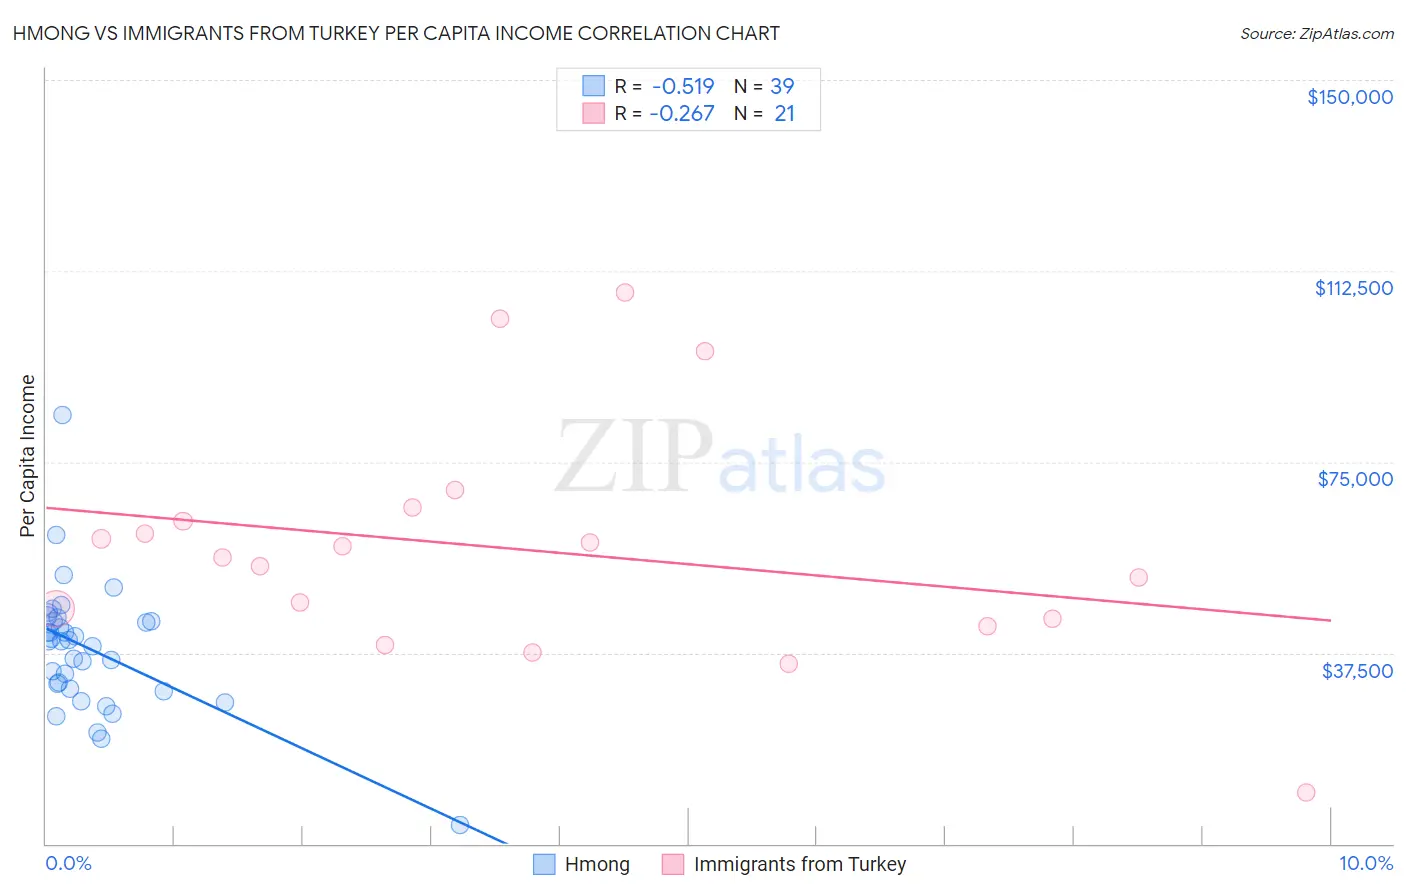
Hmong vs Immigrants from Turkey Per Capita Income Correlation Chart

The statistical analysis conducted on geographies consisting of 24,672,334 people shows a substantial negative correlation between the proportion of Hmong and per capita income in the United States with a correlation coefficient (R) of -0.519 and weighted average of $38,120. Similarly, the statistical analysis conducted on geographies consisting of 223,057,840 people shows a weak negative correlation between the proportion of Immigrants from Turkey and per capita income in the United States with a correlation coefficient (R) of -0.267 and weighted average of $51,368, a difference of 34.7%.
Hmong vs Immigrants from Turkey Per Capita Income

Per Capita Income Correlation Summary

MeasurementHmongImmigrants from Turkey
Minimum$3,563$10,156
Maximum$84,315$108,195
Range$80,752$98,039
Mean$38,244$57,681
Median$39,777$56,181
Interquartile 25% (IQ1)$30,464$43,465
Interquartile 75% (IQ3)$43,732$64,694
Interquartile Range (IQR)$13,268$21,229
Standard Deviation (Sample)$12,703$23,007
Standard Deviation (Population)$12,539$22,452

Similar Demographics by Per Capita Income

Demographics Similar to Hmong by Per Capita Income

In terms of per capita income, the demographic groups most similar to Hmong are Comanche ($38,088, a difference of 0.080%), Immigrants from Liberia ($38,165, a difference of 0.12%), Immigrants from Nicaragua ($38,065, a difference of 0.15%), Colville ($38,047, a difference of 0.19%), and Potawatomi ($38,046, a difference of 0.20%).
DemographicsRating | RankPer Capita Income
Immigrants | Jamaica
0.4
/100
|
#269
Tragic
$38,766
Immigrants | Belize
0.3
/100
|
#270
Tragic
$38,614
Central Americans
0.3
/100
|
#271
Tragic
$38,560
Immigrants | Cabo Verde
0.3
/100
|
#272
Tragic
$38,540
Nepalese
0.3
/100
|
#273
Tragic
$38,442
Immigrants | El Salvador
0.3
/100
|
#274
Tragic
$38,394
Immigrants | Liberia
0.2
/100
|
#275
Tragic
$38,165
Hmong
0.2
/100
|
#276
Tragic
$38,120
Comanche
0.2
/100
|
#277
Tragic
$38,088
Immigrants | Nicaragua
0.2
/100
|
#278
Tragic
$38,065
Colville
0.2
/100
|
#279
Tragic
$38,047
Potawatomi
0.2
/100
|
#280
Tragic
$38,046
Immigrants | Dominica
0.2
/100
|
#281
Tragic
$37,952
Immigrants | Laos
0.1
/100
|
#282
Tragic
$37,857
Pennsylvania Germans
0.1
/100
|
#283
Tragic
$37,842

Demographics Similar to Immigrants from Turkey by Per Capita Income

In terms of per capita income, the demographic groups most similar to Immigrants from Turkey are Immigrants from Lithuania ($51,361, a difference of 0.010%), Immigrants from South Africa ($51,465, a difference of 0.19%), Immigrants from Korea ($51,671, a difference of 0.59%), Cambodian ($51,731, a difference of 0.71%), and Immigrants from Czechoslovakia ($51,770, a difference of 0.78%).
DemographicsRating | RankPer Capita Income
Burmese
100.0
/100
|
#35
Exceptional
$52,005
Immigrants | Greece
100.0
/100
|
#36
Exceptional
$51,891
Estonians
100.0
/100
|
#37
Exceptional
$51,875
Immigrants | Czechoslovakia
100.0
/100
|
#38
Exceptional
$51,770
Cambodians
100.0
/100
|
#39
Exceptional
$51,731
Immigrants | Korea
100.0
/100
|
#40
Exceptional
$51,671
Immigrants | South Africa
100.0
/100
|
#41
Exceptional
$51,465
Immigrants | Turkey
100.0
/100
|
#42
Exceptional
$51,368
Immigrants | Lithuania
100.0
/100
|
#43
Exceptional
$51,361
Immigrants | Europe
100.0
/100
|
#44
Exceptional
$50,950
Immigrants | Spain
100.0
/100
|
#45
Exceptional
$50,933
Immigrants | Latvia
100.0
/100
|
#46
Exceptional
$50,914
Bulgarians
100.0
/100
|
#47
Exceptional
$50,906
Immigrants | Serbia
100.0
/100
|
#48
Exceptional
$50,810
New Zealanders
100.0
/100
|
#49
Exceptional
$50,575