Immigrants from Middle Africa vs Immigrants from Western Asia Per Capita Income
COMPARE
Immigrants from Middle Africa
Immigrants from Western Asia
Per Capita Income
Per Capita Income Comparison
Immigrants from Middle Africa
Immigrants from Western Asia
$39,529
PER CAPITA INCOME
1.0/ 100
METRIC RATING
255th/ 347
METRIC RANK
$46,876
PER CAPITA INCOME
97.4/ 100
METRIC RATING
102nd/ 347
METRIC RANK
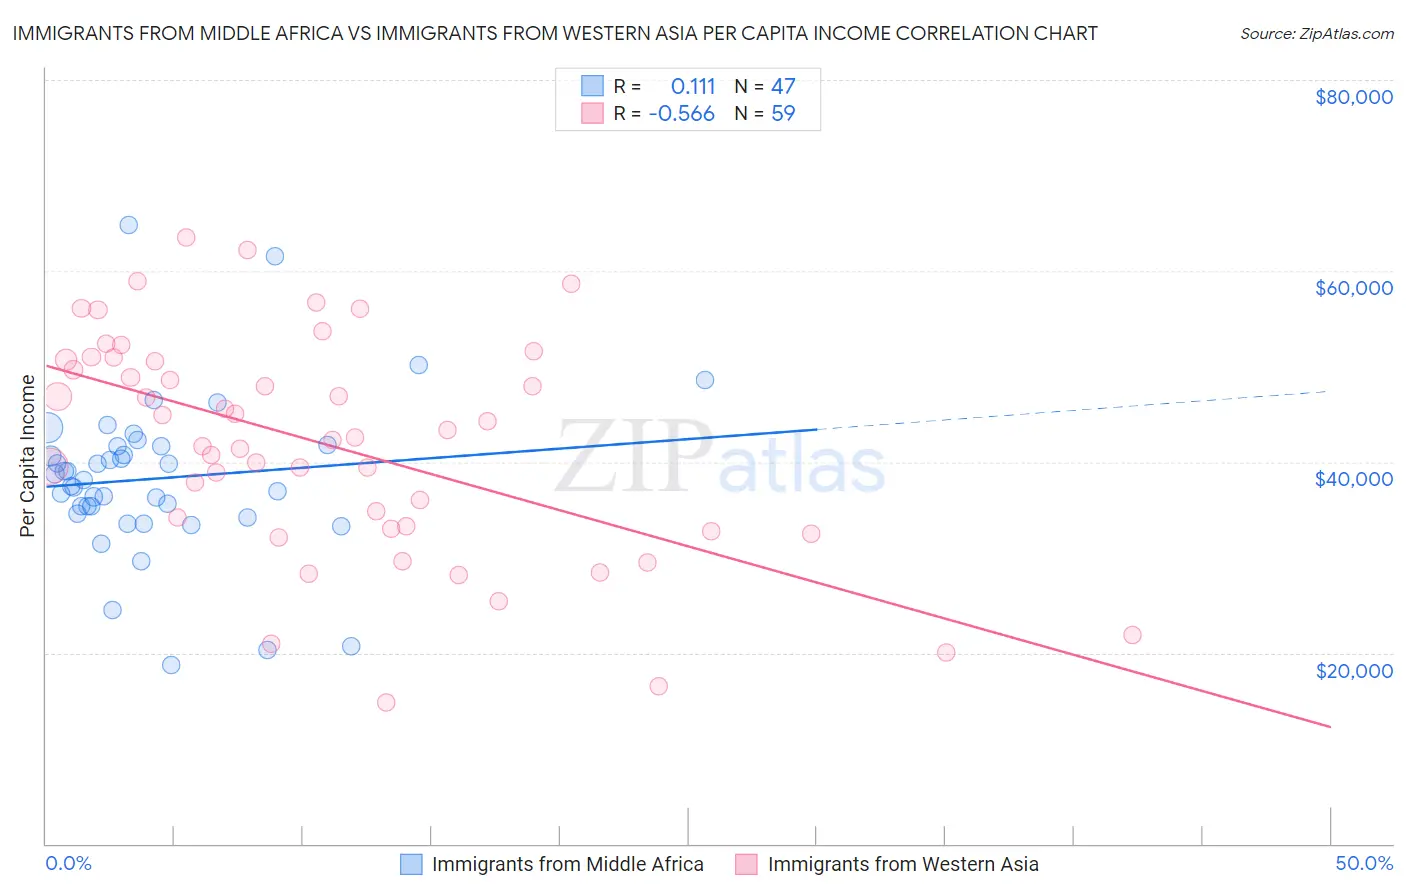
Immigrants from Middle Africa vs Immigrants from Western Asia Per Capita Income Correlation Chart
The statistical analysis conducted on geographies consisting of 202,748,114 people shows a poor positive correlation between the proportion of Immigrants from Middle Africa and per capita income in the United States with a correlation coefficient (R) of 0.111 and weighted average of $39,529. Similarly, the statistical analysis conducted on geographies consisting of 404,456,113 people shows a substantial negative correlation between the proportion of Immigrants from Western Asia and per capita income in the United States with a correlation coefficient (R) of -0.566 and weighted average of $46,876, a difference of 18.6%.
Per Capita Income Correlation Summary
| Measurement | Immigrants from Middle Africa | Immigrants from Western Asia |
| Minimum | $18,741 | $14,820 |
| Maximum | $64,792 | $63,449 |
| Range | $46,051 | $48,629 |
| Mean | $38,268 | $41,748 |
| Median | $38,152 | $42,571 |
| Interquartile 25% (IQ1) | $34,623 | $33,011 |
| Interquartile 75% (IQ3) | $41,622 | $50,679 |
| Interquartile Range (IQR) | $6,999 | $17,668 |
| Standard Deviation (Sample) | $8,450 | $11,611 |
| Standard Deviation (Population) | $8,360 | $11,513 |
Similar Demographics by Per Capita Income
Demographics Similar to Immigrants from Middle Africa by Per Capita Income
In terms of per capita income, the demographic groups most similar to Immigrants from Middle Africa are Alaska Native ($39,558, a difference of 0.070%), Osage ($39,568, a difference of 0.10%), Immigrants from the Azores ($39,608, a difference of 0.20%), Hawaiian ($39,403, a difference of 0.32%), and Nicaraguan ($39,372, a difference of 0.40%).
| Demographics | Rating | Rank | Per Capita Income |
| Cape Verdeans | 1.5 /100 | #248 | Tragic $39,935 |
| Japanese | 1.4 /100 | #249 | Tragic $39,870 |
| Immigrants | Burma/Myanmar | 1.3 /100 | #250 | Tragic $39,827 |
| Samoans | 1.3 /100 | #251 | Tragic $39,826 |
| Immigrants | Azores | 1.0 /100 | #252 | Tragic $39,608 |
| Osage | 1.0 /100 | #253 | Tragic $39,568 |
| Alaska Natives | 1.0 /100 | #254 | Tragic $39,558 |
| Immigrants | Middle Africa | 1.0 /100 | #255 | Tragic $39,529 |
| Hawaiians | 0.8 /100 | #256 | Tragic $39,403 |
| Nicaraguans | 0.8 /100 | #257 | Tragic $39,372 |
| Jamaicans | 0.7 /100 | #258 | Tragic $39,231 |
| Malaysians | 0.7 /100 | #259 | Tragic $39,194 |
| Alaskan Athabascans | 0.6 /100 | #260 | Tragic $39,163 |
| Marshallese | 0.6 /100 | #261 | Tragic $39,108 |
| Iroquois | 0.6 /100 | #262 | Tragic $39,104 |
Demographics Similar to Immigrants from Western Asia by Per Capita Income
In terms of per capita income, the demographic groups most similar to Immigrants from Western Asia are Syrian ($46,837, a difference of 0.080%), Immigrants from Uzbekistan ($46,929, a difference of 0.11%), Immigrants from Lebanon ($46,938, a difference of 0.13%), Laotian ($47,041, a difference of 0.35%), and Brazilian ($46,700, a difference of 0.38%).
| Demographics | Rating | Rank | Per Capita Income |
| Immigrants | Egypt | 98.5 /100 | #95 | Exceptional $47,361 |
| Alsatians | 98.3 /100 | #96 | Exceptional $47,284 |
| Carpatho Rusyns | 98.2 /100 | #97 | Exceptional $47,248 |
| Immigrants | Pakistan | 97.9 /100 | #98 | Exceptional $47,084 |
| Laotians | 97.8 /100 | #99 | Exceptional $47,041 |
| Immigrants | Lebanon | 97.5 /100 | #100 | Exceptional $46,938 |
| Immigrants | Uzbekistan | 97.5 /100 | #101 | Exceptional $46,929 |
| Immigrants | Western Asia | 97.4 /100 | #102 | Exceptional $46,876 |
| Syrians | 97.2 /100 | #103 | Exceptional $46,837 |
| Brazilians | 96.8 /100 | #104 | Exceptional $46,700 |
| British | 96.3 /100 | #105 | Exceptional $46,571 |
| Ethiopians | 96.3 /100 | #106 | Exceptional $46,569 |
| Serbians | 96.2 /100 | #107 | Exceptional $46,551 |
| Immigrants | Kuwait | 96.2 /100 | #108 | Exceptional $46,543 |
| Immigrants | Northern Africa | 96.2 /100 | #109 | Exceptional $46,531 |