Hmong vs Venezuelan Per Capita Income
COMPARE
Hmong
Venezuelan
Per Capita Income
Per Capita Income Comparison
Hmong
Venezuelans
$38,120
PER CAPITA INCOME
0.2/ 100
METRIC RATING
276th/ 347
METRIC RANK
$42,074
PER CAPITA INCOME
14.4/ 100
METRIC RATING
207th/ 347
METRIC RANK
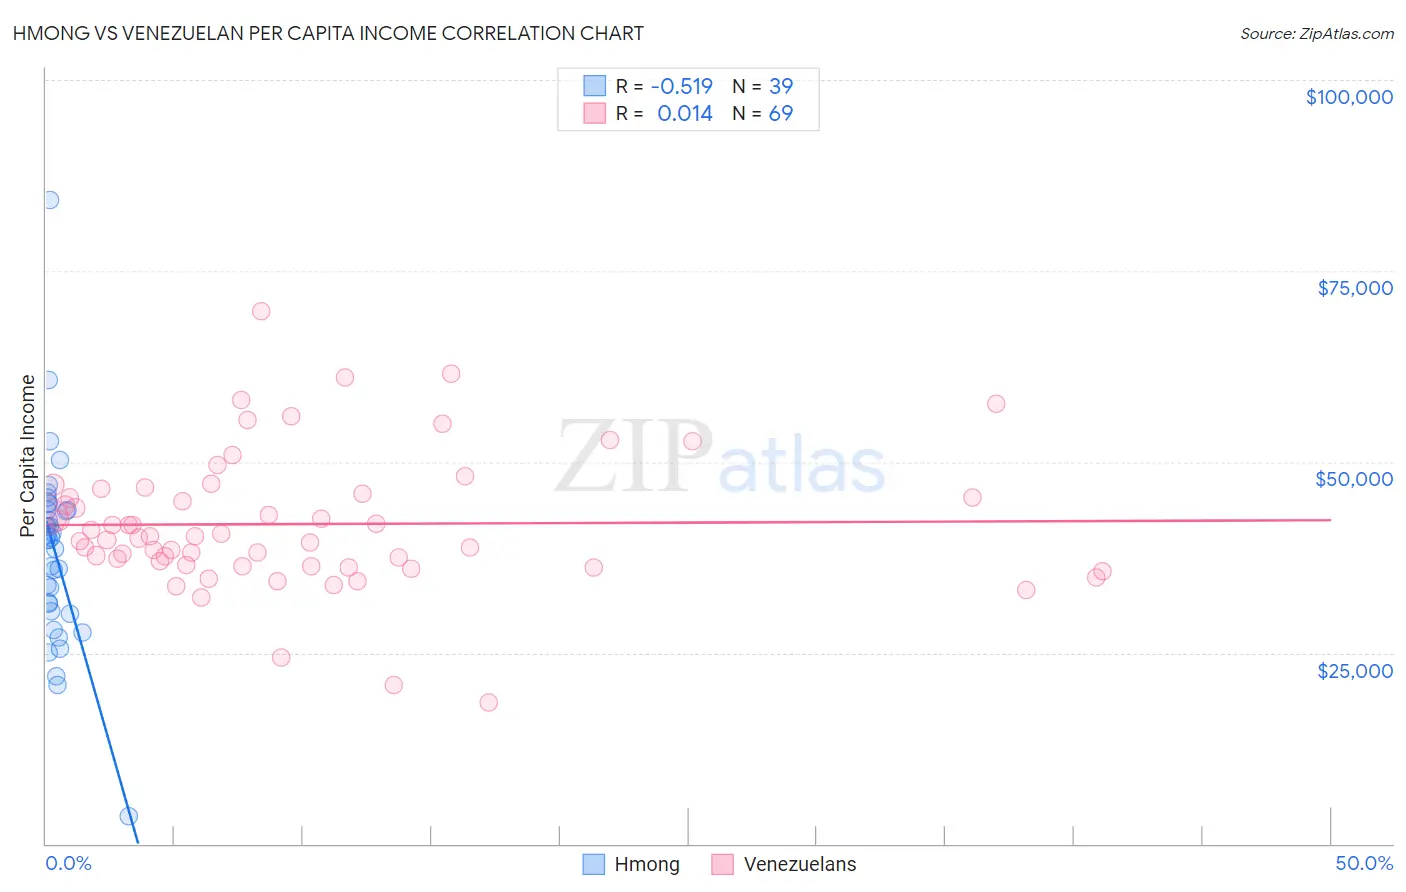
Hmong vs Venezuelan Per Capita Income Correlation Chart
The statistical analysis conducted on geographies consisting of 24,672,334 people shows a substantial negative correlation between the proportion of Hmong and per capita income in the United States with a correlation coefficient (R) of -0.519 and weighted average of $38,120. Similarly, the statistical analysis conducted on geographies consisting of 306,315,613 people shows no correlation between the proportion of Venezuelans and per capita income in the United States with a correlation coefficient (R) of 0.014 and weighted average of $42,074, a difference of 10.4%.
Per Capita Income Correlation Summary
| Measurement | Hmong | Venezuelan |
| Minimum | $3,563 | $18,497 |
| Maximum | $84,315 | $69,728 |
| Range | $80,752 | $51,231 |
| Mean | $38,244 | $41,856 |
| Median | $39,777 | $40,215 |
| Interquartile 25% (IQ1) | $30,464 | $36,400 |
| Interquartile 75% (IQ3) | $43,732 | $46,139 |
| Interquartile Range (IQR) | $13,268 | $9,740 |
| Standard Deviation (Sample) | $12,703 | $8,927 |
| Standard Deviation (Population) | $12,539 | $8,862 |
Similar Demographics by Per Capita Income
Demographics Similar to Hmong by Per Capita Income
In terms of per capita income, the demographic groups most similar to Hmong are Comanche ($38,088, a difference of 0.080%), Immigrants from Liberia ($38,165, a difference of 0.12%), Immigrants from Nicaragua ($38,065, a difference of 0.15%), Colville ($38,047, a difference of 0.19%), and Potawatomi ($38,046, a difference of 0.20%).
| Demographics | Rating | Rank | Per Capita Income |
| Immigrants | Jamaica | 0.4 /100 | #269 | Tragic $38,766 |
| Immigrants | Belize | 0.3 /100 | #270 | Tragic $38,614 |
| Central Americans | 0.3 /100 | #271 | Tragic $38,560 |
| Immigrants | Cabo Verde | 0.3 /100 | #272 | Tragic $38,540 |
| Nepalese | 0.3 /100 | #273 | Tragic $38,442 |
| Immigrants | El Salvador | 0.3 /100 | #274 | Tragic $38,394 |
| Immigrants | Liberia | 0.2 /100 | #275 | Tragic $38,165 |
| Hmong | 0.2 /100 | #276 | Tragic $38,120 |
| Comanche | 0.2 /100 | #277 | Tragic $38,088 |
| Immigrants | Nicaragua | 0.2 /100 | #278 | Tragic $38,065 |
| Colville | 0.2 /100 | #279 | Tragic $38,047 |
| Potawatomi | 0.2 /100 | #280 | Tragic $38,046 |
| Immigrants | Dominica | 0.2 /100 | #281 | Tragic $37,952 |
| Immigrants | Laos | 0.1 /100 | #282 | Tragic $37,857 |
| Pennsylvania Germans | 0.1 /100 | #283 | Tragic $37,842 |
Demographics Similar to Venezuelans by Per Capita Income
In terms of per capita income, the demographic groups most similar to Venezuelans are Panamanian ($42,035, a difference of 0.090%), Ghanaian ($42,164, a difference of 0.21%), Immigrants from Sudan ($41,986, a difference of 0.21%), White/Caucasian ($42,180, a difference of 0.25%), and Ecuadorian ($41,958, a difference of 0.28%).
| Demographics | Rating | Rank | Per Capita Income |
| Vietnamese | 19.0 /100 | #200 | Poor $42,368 |
| Immigrants | Thailand | 17.6 /100 | #201 | Poor $42,289 |
| Immigrants | Bosnia and Herzegovina | 17.5 /100 | #202 | Poor $42,278 |
| Spanish | 17.0 /100 | #203 | Poor $42,249 |
| Aleuts | 16.4 /100 | #204 | Poor $42,210 |
| Whites/Caucasians | 15.9 /100 | #205 | Poor $42,180 |
| Ghanaians | 15.7 /100 | #206 | Poor $42,164 |
| Venezuelans | 14.4 /100 | #207 | Poor $42,074 |
| Panamanians | 13.9 /100 | #208 | Poor $42,035 |
| Immigrants | Sudan | 13.2 /100 | #209 | Poor $41,986 |
| Ecuadorians | 12.9 /100 | #210 | Poor $41,958 |
| Immigrants | Panama | 11.6 /100 | #211 | Poor $41,853 |
| Immigrants | Senegal | 11.3 /100 | #212 | Poor $41,830 |
| Immigrants | Venezuela | 10.2 /100 | #213 | Poor $41,727 |
| Immigrants | Bangladesh | 10.1 /100 | #214 | Poor $41,709 |