Hmong vs Immigrants from Turkey Unemployment Among Women with Children Under 6 years
COMPARE
Hmong
Immigrants from Turkey
Unemployment Among Women with Children Under 6 years
Unemployment Among Women with Children Under 6 years Comparison
Hmong
Immigrants from Turkey
6.7%
UNEMPLOYMENT AMONG WOMEN WITH CHILDREN UNDER 6 YEARS
100.0/ 100
METRIC RATING
38th/ 347
METRIC RANK
6.9%
UNEMPLOYMENT AMONG WOMEN WITH CHILDREN UNDER 6 YEARS
99.8/ 100
METRIC RATING
58th/ 347
METRIC RANK
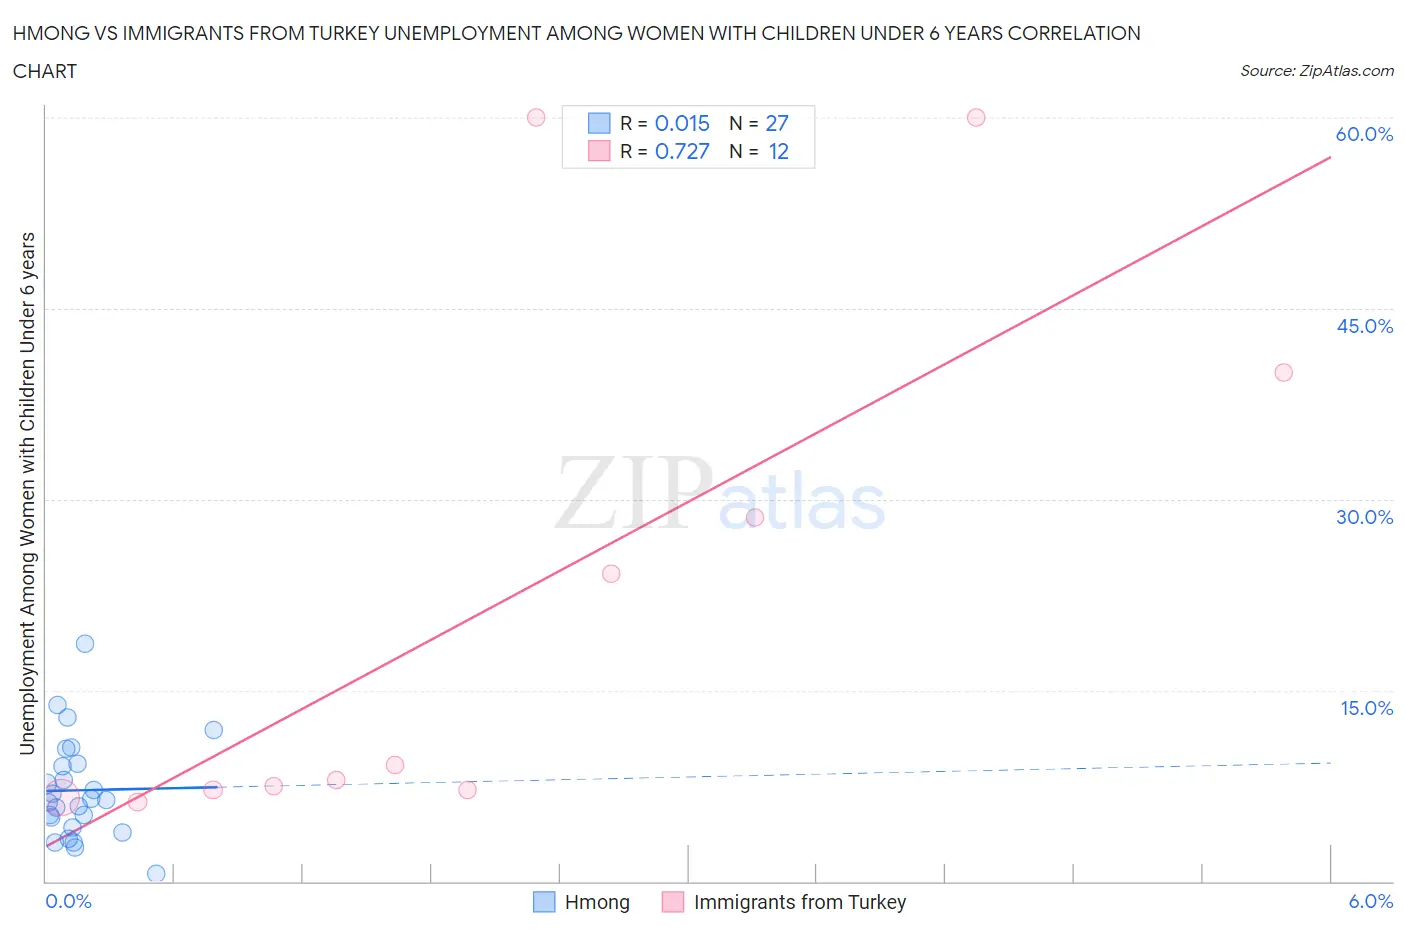
Hmong vs Immigrants from Turkey Unemployment Among Women with Children Under 6 years Correlation Chart
The statistical analysis conducted on geographies consisting of 24,062,767 people shows no correlation between the proportion of Hmong and unemployment rate among women with children under the age of 6 in the United States with a correlation coefficient (R) of 0.015 and weighted average of 6.7%. Similarly, the statistical analysis conducted on geographies consisting of 185,874,428 people shows a strong positive correlation between the proportion of Immigrants from Turkey and unemployment rate among women with children under the age of 6 in the United States with a correlation coefficient (R) of 0.727 and weighted average of 6.9%, a difference of 3.2%.
Unemployment Among Women with Children Under 6 years Correlation Summary
| Measurement | Hmong | Immigrants from Turkey |
| Minimum | 0.60% | 6.2% |
| Maximum | 18.7% | 60.0% |
| Range | 18.1% | 53.8% |
| Mean | 7.2% | 22.0% |
| Median | 6.4% | 8.5% |
| Interquartile 25% (IQ1) | 4.3% | 7.1% |
| Interquartile 75% (IQ3) | 9.2% | 34.3% |
| Interquartile Range (IQR) | 4.9% | 27.2% |
| Standard Deviation (Sample) | 4.0% | 20.8% |
| Standard Deviation (Population) | 3.9% | 19.9% |
Demographics Similar to Hmong and Immigrants from Turkey by Unemployment Among Women with Children Under 6 years
In terms of unemployment among women with children under 6 years, the demographic groups most similar to Hmong are Immigrants from Russia (6.7%, a difference of 0.060%), Asian (6.7%, a difference of 0.28%), Immigrants from Indonesia (6.7%, a difference of 0.44%), Immigrants from Cuba (6.7%, a difference of 0.54%), and Bhutanese (6.7%, a difference of 0.82%). Similarly, the demographic groups most similar to Immigrants from Turkey are Immigrants from Ethiopia (6.9%, a difference of 0.23%), Icelander (6.9%, a difference of 0.23%), Immigrants from Ukraine (6.8%, a difference of 0.34%), Immigrants from Latvia (6.8%, a difference of 0.83%), and Chinese (6.8%, a difference of 1.0%).
| Demographics | Rating | Rank | Unemployment Among Women with Children Under 6 years |
| Hmong | 100.0 /100 | #38 | Exceptional 6.7% |
| Immigrants | Russia | 100.0 /100 | #39 | Exceptional 6.7% |
| Asians | 100.0 /100 | #40 | Exceptional 6.7% |
| Immigrants | Indonesia | 99.9 /100 | #41 | Exceptional 6.7% |
| Immigrants | Cuba | 99.9 /100 | #42 | Exceptional 6.7% |
| Bhutanese | 99.9 /100 | #43 | Exceptional 6.7% |
| Iranians | 99.9 /100 | #44 | Exceptional 6.7% |
| Immigrants | Australia | 99.9 /100 | #45 | Exceptional 6.8% |
| Latvians | 99.9 /100 | #46 | Exceptional 6.8% |
| Immigrants | Asia | 99.9 /100 | #47 | Exceptional 6.8% |
| Immigrants | Switzerland | 99.9 /100 | #48 | Exceptional 6.8% |
| Immigrants | Nepal | 99.9 /100 | #49 | Exceptional 6.8% |
| Immigrants | Ireland | 99.9 /100 | #50 | Exceptional 6.8% |
| Ethiopians | 99.9 /100 | #51 | Exceptional 6.8% |
| Immigrants | Iran | 99.9 /100 | #52 | Exceptional 6.8% |
| Chinese | 99.9 /100 | #53 | Exceptional 6.8% |
| Immigrants | Latvia | 99.9 /100 | #54 | Exceptional 6.8% |
| Immigrants | Ukraine | 99.8 /100 | #55 | Exceptional 6.8% |
| Immigrants | Ethiopia | 99.8 /100 | #56 | Exceptional 6.9% |
| Icelanders | 99.8 /100 | #57 | Exceptional 6.9% |
| Immigrants | Turkey | 99.8 /100 | #58 | Exceptional 6.9% |