Hmong vs Immigrants from Turkey Male Unemployment
COMPARE
Hmong
Immigrants from Turkey
Male Unemployment
Male Unemployment Comparison
Hmong
Immigrants from Turkey
5.5%
MALE UNEMPLOYMENT
7.0/ 100
METRIC RATING
212th/ 347
METRIC RANK
5.1%
MALE UNEMPLOYMENT
94.4/ 100
METRIC RATING
91st/ 347
METRIC RANK
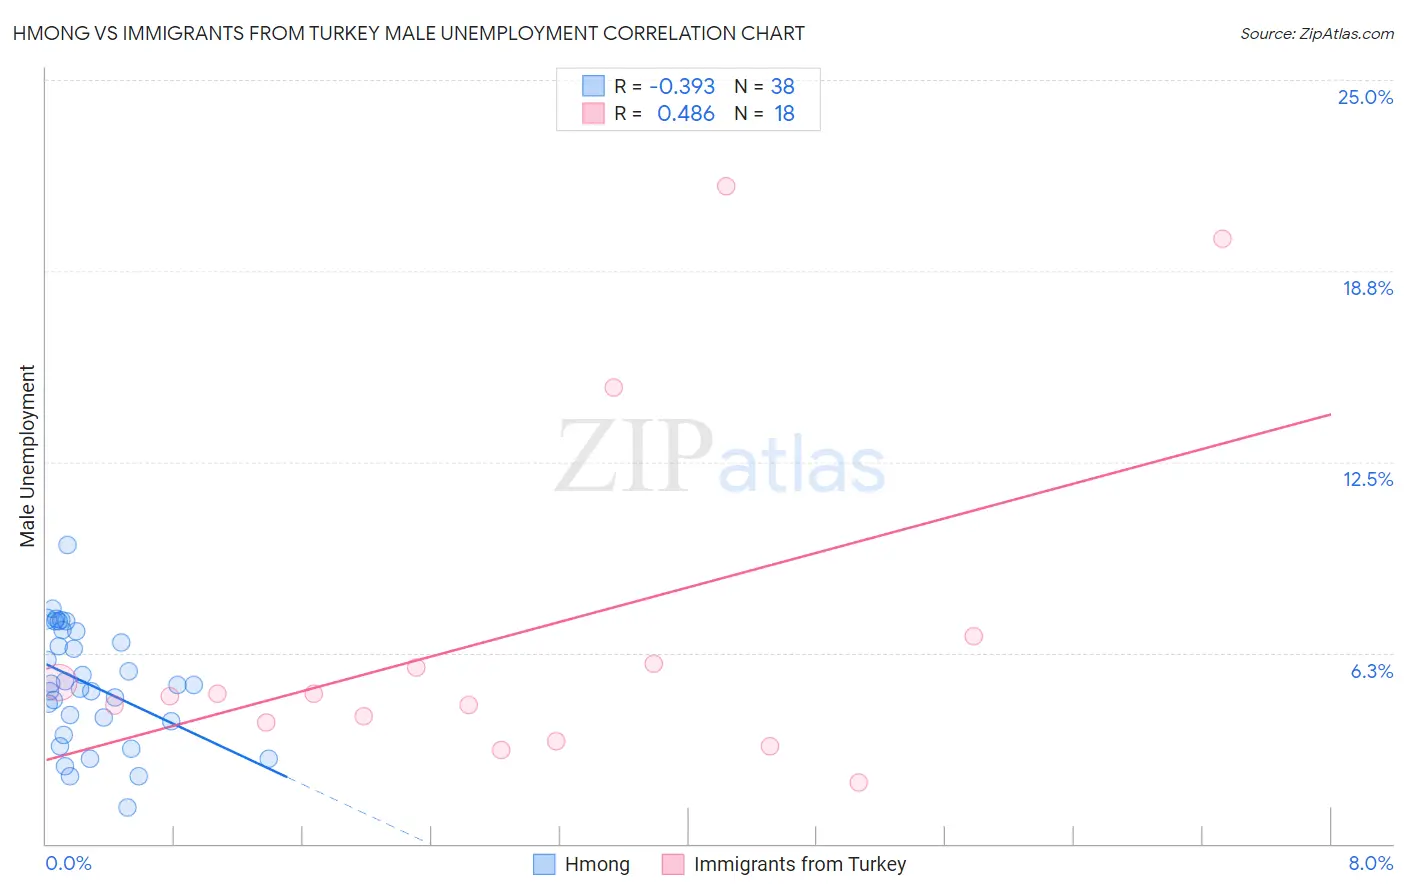
Hmong vs Immigrants from Turkey Male Unemployment Correlation Chart
The statistical analysis conducted on geographies consisting of 24,680,008 people shows a mild negative correlation between the proportion of Hmong and unemployment rate among males in the United States with a correlation coefficient (R) of -0.393 and weighted average of 5.5%. Similarly, the statistical analysis conducted on geographies consisting of 222,708,135 people shows a moderate positive correlation between the proportion of Immigrants from Turkey and unemployment rate among males in the United States with a correlation coefficient (R) of 0.486 and weighted average of 5.1%, a difference of 8.3%.
Male Unemployment Correlation Summary
| Measurement | Hmong | Immigrants from Turkey |
| Minimum | 1.2% | 2.0% |
| Maximum | 9.8% | 21.5% |
| Range | 8.6% | 19.5% |
| Mean | 5.2% | 6.9% |
| Median | 5.2% | 4.9% |
| Interquartile 25% (IQ1) | 4.0% | 4.0% |
| Interquartile 75% (IQ3) | 7.0% | 5.9% |
| Interquartile Range (IQR) | 3.0% | 1.9% |
| Standard Deviation (Sample) | 1.9% | 5.7% |
| Standard Deviation (Population) | 1.9% | 5.5% |
Similar Demographics by Male Unemployment
Demographics Similar to Hmong by Male Unemployment
In terms of male unemployment, the demographic groups most similar to Hmong are Israeli (5.5%, a difference of 0.090%), South American Indian (5.5%, a difference of 0.14%), Ugandan (5.5%, a difference of 0.16%), Immigrants from Middle Africa (5.5%, a difference of 0.27%), and Immigrants from Lebanon (5.5%, a difference of 0.32%).
| Demographics | Rating | Rank | Male Unemployment |
| Immigrants | Costa Rica | 11.4 /100 | #205 | Poor 5.5% |
| Immigrants | Ukraine | 9.9 /100 | #206 | Tragic 5.5% |
| Immigrants | Syria | 9.3 /100 | #207 | Tragic 5.5% |
| Immigrants | Lebanon | 8.6 /100 | #208 | Tragic 5.5% |
| Immigrants | Middle Africa | 8.3 /100 | #209 | Tragic 5.5% |
| South American Indians | 7.6 /100 | #210 | Tragic 5.5% |
| Israelis | 7.4 /100 | #211 | Tragic 5.5% |
| Hmong | 7.0 /100 | #212 | Tragic 5.5% |
| Ugandans | 6.3 /100 | #213 | Tragic 5.5% |
| Puget Sound Salish | 5.6 /100 | #214 | Tragic 5.5% |
| Samoans | 4.9 /100 | #215 | Tragic 5.5% |
| Immigrants | Immigrants | 4.3 /100 | #216 | Tragic 5.5% |
| Delaware | 4.2 /100 | #217 | Tragic 5.5% |
| Immigrants | Albania | 3.6 /100 | #218 | Tragic 5.5% |
| Immigrants | Western Asia | 3.5 /100 | #219 | Tragic 5.6% |
Demographics Similar to Immigrants from Turkey by Male Unemployment
In terms of male unemployment, the demographic groups most similar to Immigrants from Turkey are Slavic (5.1%, a difference of 0.060%), Immigrants from Serbia (5.1%, a difference of 0.060%), Okinawan (5.1%, a difference of 0.080%), Immigrants from Australia (5.1%, a difference of 0.090%), and Canadian (5.1%, a difference of 0.10%).
| Demographics | Rating | Rank | Male Unemployment |
| Serbians | 95.7 /100 | #84 | Exceptional 5.1% |
| Immigrants | North Macedonia | 95.6 /100 | #85 | Exceptional 5.1% |
| Maltese | 95.5 /100 | #86 | Exceptional 5.1% |
| Immigrants | Romania | 95.4 /100 | #87 | Exceptional 5.1% |
| Immigrants | Sri Lanka | 94.9 /100 | #88 | Exceptional 5.1% |
| Immigrants | Australia | 94.7 /100 | #89 | Exceptional 5.1% |
| Okinawans | 94.7 /100 | #90 | Exceptional 5.1% |
| Immigrants | Turkey | 94.4 /100 | #91 | Exceptional 5.1% |
| Slavs | 94.2 /100 | #92 | Exceptional 5.1% |
| Immigrants | Serbia | 94.2 /100 | #93 | Exceptional 5.1% |
| Canadians | 94.1 /100 | #94 | Exceptional 5.1% |
| Italians | 93.8 /100 | #95 | Exceptional 5.1% |
| Asians | 93.7 /100 | #96 | Exceptional 5.1% |
| Immigrants | Spain | 93.4 /100 | #97 | Exceptional 5.1% |
| Immigrants | Kuwait | 93.3 /100 | #98 | Exceptional 5.1% |