Immigrants from India vs Immigrants from Bahamas Median Male Earnings
COMPARE
Immigrants from India
Immigrants from Bahamas
Median Male Earnings
Median Male Earnings Comparison
Immigrants from India
Immigrants from Bahamas
$74,207
MEDIAN MALE EARNINGS
100.0/ 100
METRIC RATING
2nd/ 347
METRIC RANK
$45,176
MEDIAN MALE EARNINGS
0.0/ 100
METRIC RATING
327th/ 347
METRIC RANK
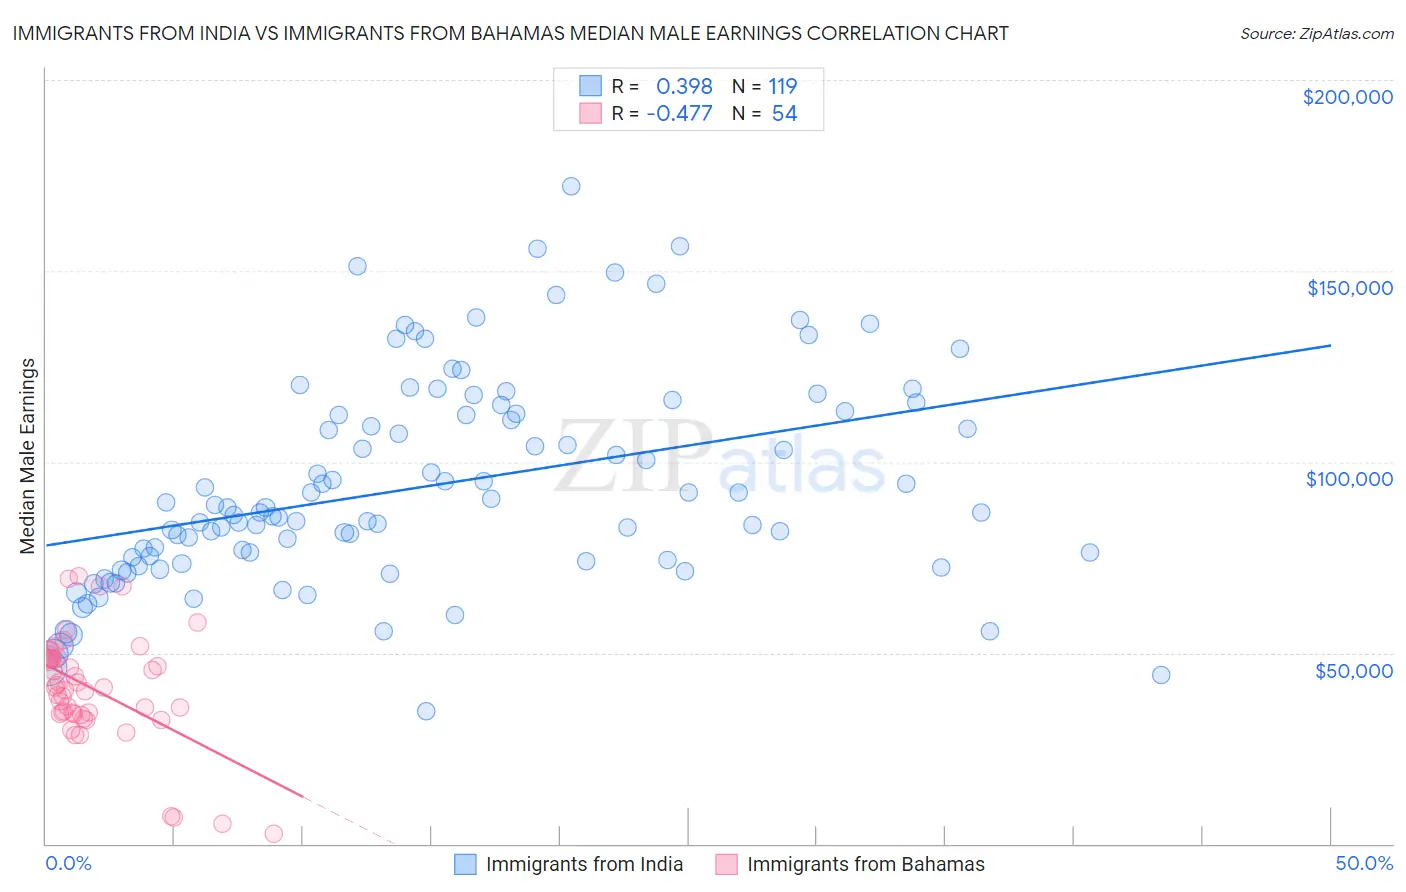
Immigrants from India vs Immigrants from Bahamas Median Male Earnings Correlation Chart
The statistical analysis conducted on geographies consisting of 434,025,837 people shows a mild positive correlation between the proportion of Immigrants from India and median male earnings in the United States with a correlation coefficient (R) of 0.398 and weighted average of $74,207. Similarly, the statistical analysis conducted on geographies consisting of 104,652,587 people shows a moderate negative correlation between the proportion of Immigrants from Bahamas and median male earnings in the United States with a correlation coefficient (R) of -0.477 and weighted average of $45,176, a difference of 64.3%.
Median Male Earnings Correlation Summary
| Measurement | Immigrants from India | Immigrants from Bahamas |
| Minimum | $34,783 | $2,499 |
| Maximum | $172,259 | $70,069 |
| Range | $137,476 | $67,570 |
| Mean | $93,517 | $40,703 |
| Median | $86,905 | $41,071 |
| Interquartile 25% (IQ1) | $74,008 | $34,087 |
| Interquartile 75% (IQ3) | $112,721 | $48,539 |
| Interquartile Range (IQR) | $38,713 | $14,452 |
| Standard Deviation (Sample) | $27,317 | $14,317 |
| Standard Deviation (Population) | $27,202 | $14,184 |
Similar Demographics by Median Male Earnings
Demographics Similar to Immigrants from India by Median Male Earnings
In terms of median male earnings, the demographic groups most similar to Immigrants from India are Filipino ($74,224, a difference of 0.020%), Immigrants from Taiwan ($74,031, a difference of 0.24%), Thai ($72,135, a difference of 2.9%), Immigrants from Singapore ($71,348, a difference of 4.0%), and Iranian ($70,648, a difference of 5.0%).
| Demographics | Rating | Rank | Median Male Earnings |
| Filipinos | 100.0 /100 | #1 | Exceptional $74,224 |
| Immigrants | India | 100.0 /100 | #2 | Exceptional $74,207 |
| Immigrants | Taiwan | 100.0 /100 | #3 | Exceptional $74,031 |
| Thais | 100.0 /100 | #4 | Exceptional $72,135 |
| Immigrants | Singapore | 100.0 /100 | #5 | Exceptional $71,348 |
| Iranians | 100.0 /100 | #6 | Exceptional $70,648 |
| Immigrants | Hong Kong | 100.0 /100 | #7 | Exceptional $70,146 |
| Immigrants | Iran | 100.0 /100 | #8 | Exceptional $69,284 |
| Immigrants | South Central Asia | 100.0 /100 | #9 | Exceptional $68,960 |
| Immigrants | Israel | 100.0 /100 | #10 | Exceptional $68,716 |
| Immigrants | Ireland | 100.0 /100 | #11 | Exceptional $67,698 |
| Immigrants | Australia | 100.0 /100 | #12 | Exceptional $67,634 |
| Immigrants | China | 100.0 /100 | #13 | Exceptional $67,353 |
| Okinawans | 100.0 /100 | #14 | Exceptional $67,232 |
| Immigrants | Eastern Asia | 100.0 /100 | #15 | Exceptional $66,903 |
Demographics Similar to Immigrants from Bahamas by Median Male Earnings
In terms of median male earnings, the demographic groups most similar to Immigrants from Bahamas are Kiowa ($45,094, a difference of 0.18%), Immigrants from Haiti ($45,266, a difference of 0.20%), Yakama ($45,002, a difference of 0.39%), Immigrants from Mexico ($44,960, a difference of 0.48%), and Yuman ($45,446, a difference of 0.60%).
| Demographics | Rating | Rank | Median Male Earnings |
| Immigrants | Honduras | 0.0 /100 | #320 | Tragic $45,787 |
| Fijians | 0.0 /100 | #321 | Tragic $45,607 |
| Sioux | 0.0 /100 | #322 | Tragic $45,566 |
| Immigrants | Central America | 0.0 /100 | #323 | Tragic $45,538 |
| Blacks/African Americans | 0.0 /100 | #324 | Tragic $45,523 |
| Yuman | 0.0 /100 | #325 | Tragic $45,446 |
| Immigrants | Haiti | 0.0 /100 | #326 | Tragic $45,266 |
| Immigrants | Bahamas | 0.0 /100 | #327 | Tragic $45,176 |
| Kiowa | 0.0 /100 | #328 | Tragic $45,094 |
| Yakama | 0.0 /100 | #329 | Tragic $45,002 |
| Immigrants | Mexico | 0.0 /100 | #330 | Tragic $44,960 |
| Natives/Alaskans | 0.0 /100 | #331 | Tragic $44,775 |
| Bahamians | 0.0 /100 | #332 | Tragic $44,756 |
| Immigrants | Congo | 0.0 /100 | #333 | Tragic $44,204 |
| Immigrants | Yemen | 0.0 /100 | #334 | Tragic $44,083 |