Immigrants from Dominican Republic vs Immigrants from Bahamas Median Male Earnings
COMPARE
Immigrants from Dominican Republic
Immigrants from Bahamas
Median Male Earnings
Median Male Earnings Comparison
Immigrants from Dominican Republic
Immigrants from Bahamas
$46,655
MEDIAN MALE EARNINGS
0.0/ 100
METRIC RATING
307th/ 347
METRIC RANK
$45,176
MEDIAN MALE EARNINGS
0.0/ 100
METRIC RATING
327th/ 347
METRIC RANK
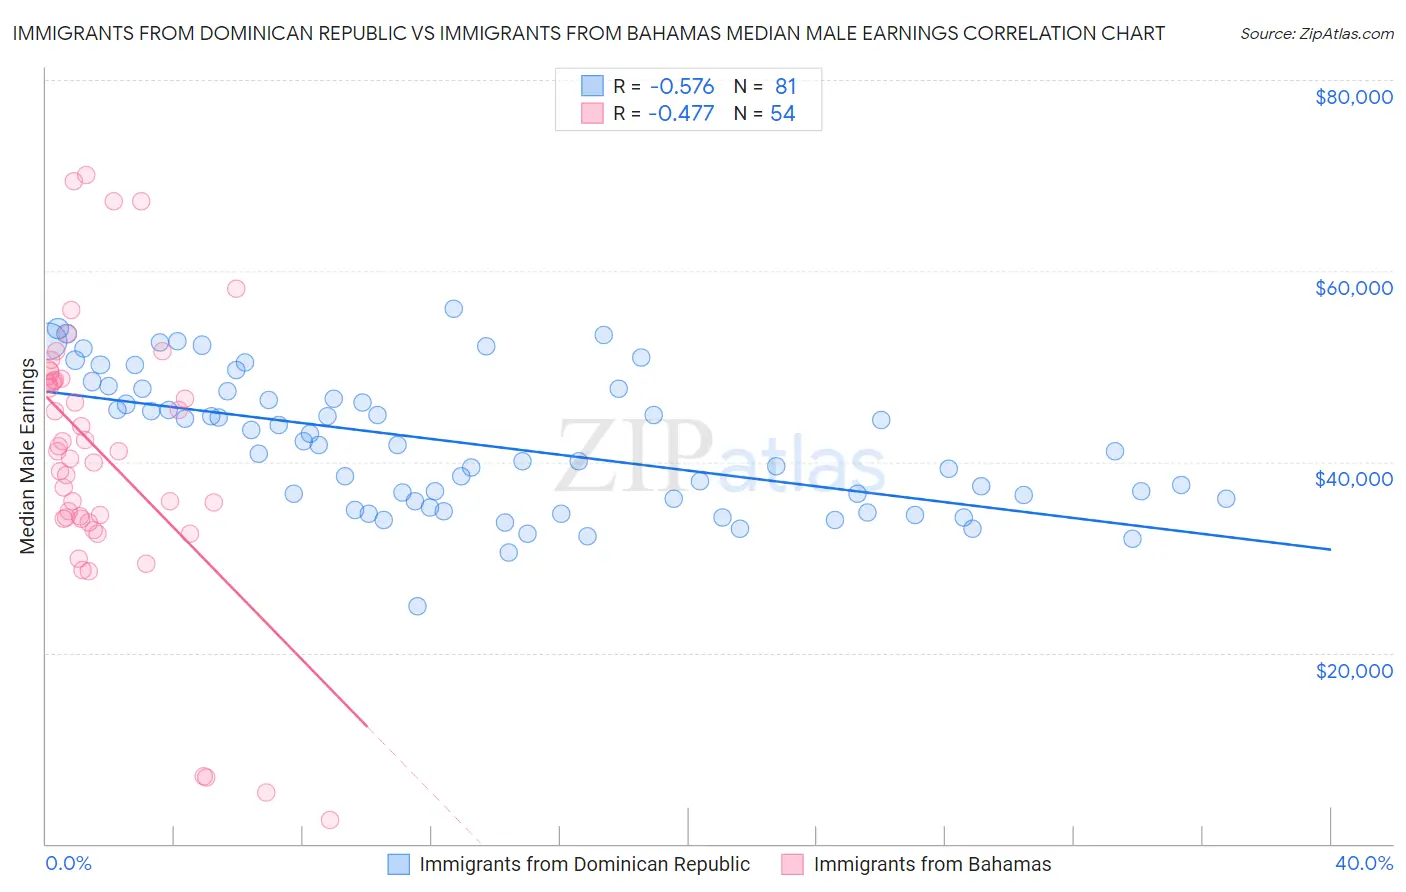
Immigrants from Dominican Republic vs Immigrants from Bahamas Median Male Earnings Correlation Chart
The statistical analysis conducted on geographies consisting of 274,998,271 people shows a substantial negative correlation between the proportion of Immigrants from Dominican Republic and median male earnings in the United States with a correlation coefficient (R) of -0.576 and weighted average of $46,655. Similarly, the statistical analysis conducted on geographies consisting of 104,652,587 people shows a moderate negative correlation between the proportion of Immigrants from Bahamas and median male earnings in the United States with a correlation coefficient (R) of -0.477 and weighted average of $45,176, a difference of 3.3%.
Median Male Earnings Correlation Summary
| Measurement | Immigrants from Dominican Republic | Immigrants from Bahamas |
| Minimum | $24,931 | $2,499 |
| Maximum | $56,014 | $70,069 |
| Range | $31,083 | $67,570 |
| Mean | $41,875 | $40,703 |
| Median | $41,710 | $41,071 |
| Interquartile 25% (IQ1) | $35,983 | $34,087 |
| Interquartile 75% (IQ3) | $47,499 | $48,539 |
| Interquartile Range (IQR) | $11,516 | $14,452 |
| Standard Deviation (Sample) | $7,016 | $14,317 |
| Standard Deviation (Population) | $6,972 | $14,184 |
Demographics Similar to Immigrants from Dominican Republic and Immigrants from Bahamas by Median Male Earnings
In terms of median male earnings, the demographic groups most similar to Immigrants from Dominican Republic are Ottawa ($46,611, a difference of 0.090%), Creek ($46,594, a difference of 0.13%), Cuban ($46,580, a difference of 0.16%), Apache ($46,429, a difference of 0.49%), and Hispanic or Latino ($46,419, a difference of 0.51%). Similarly, the demographic groups most similar to Immigrants from Bahamas are Immigrants from Haiti ($45,266, a difference of 0.20%), Yuman ($45,446, a difference of 0.60%), Black/African American ($45,523, a difference of 0.77%), Immigrants from Central America ($45,538, a difference of 0.80%), and Sioux ($45,566, a difference of 0.86%).
| Demographics | Rating | Rank | Median Male Earnings |
| Immigrants | Dominican Republic | 0.0 /100 | #307 | Tragic $46,655 |
| Ottawa | 0.0 /100 | #308 | Tragic $46,611 |
| Creek | 0.0 /100 | #309 | Tragic $46,594 |
| Cubans | 0.0 /100 | #310 | Tragic $46,580 |
| Apache | 0.0 /100 | #311 | Tragic $46,429 |
| Hispanics or Latinos | 0.0 /100 | #312 | Tragic $46,419 |
| Hondurans | 0.0 /100 | #313 | Tragic $46,374 |
| Chippewa | 0.0 /100 | #314 | Tragic $46,368 |
| Immigrants | Guatemala | 0.0 /100 | #315 | Tragic $46,244 |
| Immigrants | Caribbean | 0.0 /100 | #316 | Tragic $46,193 |
| Mexicans | 0.0 /100 | #317 | Tragic $46,147 |
| Cheyenne | 0.0 /100 | #318 | Tragic $46,062 |
| Haitians | 0.0 /100 | #319 | Tragic $45,903 |
| Immigrants | Honduras | 0.0 /100 | #320 | Tragic $45,787 |
| Fijians | 0.0 /100 | #321 | Tragic $45,607 |
| Sioux | 0.0 /100 | #322 | Tragic $45,566 |
| Immigrants | Central America | 0.0 /100 | #323 | Tragic $45,538 |
| Blacks/African Americans | 0.0 /100 | #324 | Tragic $45,523 |
| Yuman | 0.0 /100 | #325 | Tragic $45,446 |
| Immigrants | Haiti | 0.0 /100 | #326 | Tragic $45,266 |
| Immigrants | Bahamas | 0.0 /100 | #327 | Tragic $45,176 |