Costa Rican vs Immigrants from Oceania Median Earnings
COMPARE
Costa Rican
Immigrants from Oceania
Median Earnings
Median Earnings Comparison
Costa Ricans
Immigrants from Oceania
$46,645
MEDIAN EARNINGS
57.4/ 100
METRIC RATING
167th/ 347
METRIC RANK
$47,617
MEDIAN EARNINGS
84.1/ 100
METRIC RATING
151st/ 347
METRIC RANK
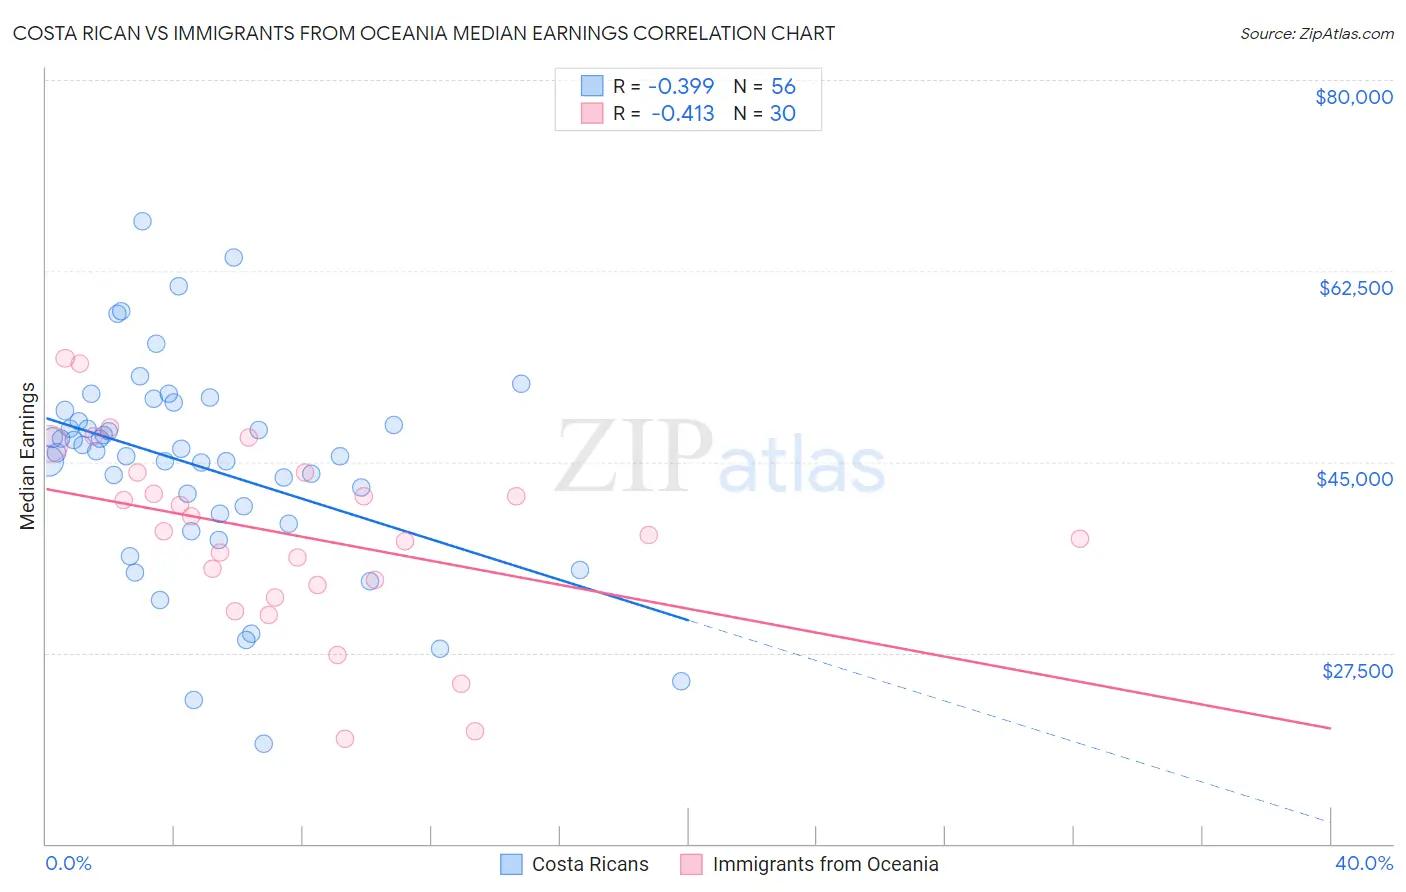
Costa Rican vs Immigrants from Oceania Median Earnings Correlation Chart
The statistical analysis conducted on geographies consisting of 253,579,984 people shows a mild negative correlation between the proportion of Costa Ricans and median earnings in the United States with a correlation coefficient (R) of -0.399 and weighted average of $46,645. Similarly, the statistical analysis conducted on geographies consisting of 305,514,828 people shows a moderate negative correlation between the proportion of Immigrants from Oceania and median earnings in the United States with a correlation coefficient (R) of -0.413 and weighted average of $47,617, a difference of 2.1%.
Median Earnings Correlation Summary
| Measurement | Costa Rican | Immigrants from Oceania |
| Minimum | $19,205 | $19,583 |
| Maximum | $67,102 | $54,486 |
| Range | $47,897 | $34,903 |
| Mean | $44,542 | $38,323 |
| Median | $45,923 | $38,462 |
| Interquartile 25% (IQ1) | $39,792 | $33,709 |
| Interquartile 75% (IQ3) | $49,211 | $44,026 |
| Interquartile Range (IQR) | $9,420 | $10,317 |
| Standard Deviation (Sample) | $9,601 | $8,581 |
| Standard Deviation (Population) | $9,515 | $8,437 |
Demographics Similar to Costa Ricans and Immigrants from Oceania by Median Earnings
In terms of median earnings, the demographic groups most similar to Costa Ricans are Czechoslovakian ($46,658, a difference of 0.030%), Immigrants from Africa ($46,564, a difference of 0.17%), Immigrants from South America ($46,548, a difference of 0.21%), South American ($46,804, a difference of 0.34%), and Norwegian ($46,865, a difference of 0.47%). Similarly, the demographic groups most similar to Immigrants from Oceania are Peruvian ($47,628, a difference of 0.020%), Luxembourger ($47,640, a difference of 0.050%), Immigrants from Germany ($47,566, a difference of 0.11%), Slavic ($47,470, a difference of 0.31%), and Immigrants from Portugal ($47,304, a difference of 0.66%).
| Demographics | Rating | Rank | Median Earnings |
| Luxembourgers | 84.5 /100 | #149 | Excellent $47,640 |
| Peruvians | 84.2 /100 | #150 | Excellent $47,628 |
| Immigrants | Oceania | 84.1 /100 | #151 | Excellent $47,617 |
| Immigrants | Germany | 83.1 /100 | #152 | Excellent $47,566 |
| Slavs | 81.1 /100 | #153 | Excellent $47,470 |
| Immigrants | Portugal | 77.3 /100 | #154 | Good $47,304 |
| Immigrants | Vietnam | 76.7 /100 | #155 | Good $47,282 |
| Irish | 76.6 /100 | #156 | Good $47,276 |
| Czechs | 75.1 /100 | #157 | Good $47,221 |
| Slovaks | 71.7 /100 | #158 | Good $47,095 |
| Immigrants | Peru | 69.6 /100 | #159 | Good $47,025 |
| Alsatians | 69.6 /100 | #160 | Good $47,023 |
| Immigrants | Eastern Africa | 68.0 /100 | #161 | Good $46,969 |
| South American Indians | 67.4 /100 | #162 | Good $46,952 |
| Icelanders | 66.3 /100 | #163 | Good $46,916 |
| Norwegians | 64.7 /100 | #164 | Good $46,865 |
| South Americans | 62.7 /100 | #165 | Good $46,804 |
| Czechoslovakians | 57.8 /100 | #166 | Average $46,658 |
| Costa Ricans | 57.4 /100 | #167 | Average $46,645 |
| Immigrants | Africa | 54.6 /100 | #168 | Average $46,564 |
| Immigrants | South America | 54.0 /100 | #169 | Average $46,548 |