Alsatian vs Immigrants from Morocco Median Earnings
COMPARE
Alsatian
Immigrants from Morocco
Median Earnings
Median Earnings Comparison
Alsatians
Immigrants from Morocco
$47,023
MEDIAN EARNINGS
69.6/ 100
METRIC RATING
160th/ 347
METRIC RANK
$49,368
MEDIAN EARNINGS
98.4/ 100
METRIC RATING
107th/ 347
METRIC RANK
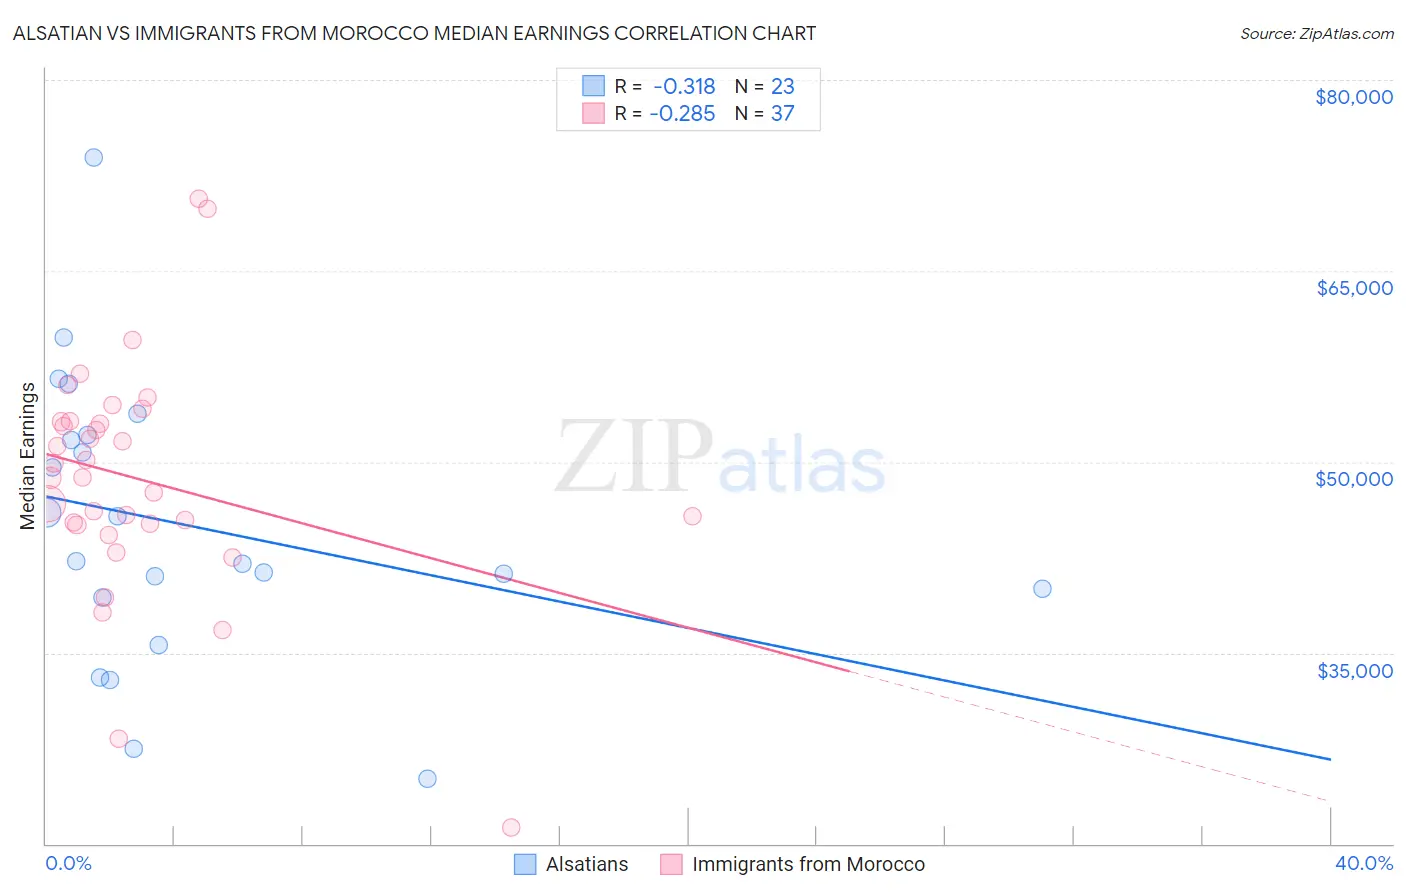
Alsatian vs Immigrants from Morocco Median Earnings Correlation Chart
The statistical analysis conducted on geographies consisting of 82,677,221 people shows a mild negative correlation between the proportion of Alsatians and median earnings in the United States with a correlation coefficient (R) of -0.318 and weighted average of $47,023. Similarly, the statistical analysis conducted on geographies consisting of 178,911,278 people shows a weak negative correlation between the proportion of Immigrants from Morocco and median earnings in the United States with a correlation coefficient (R) of -0.285 and weighted average of $49,368, a difference of 5.0%.
Median Earnings Correlation Summary
| Measurement | Alsatian | Immigrants from Morocco |
| Minimum | $25,064 | $21,250 |
| Maximum | $73,935 | $70,625 |
| Range | $48,871 | $49,375 |
| Mean | $45,093 | $48,644 |
| Median | $42,188 | $48,771 |
| Interquartile 25% (IQ1) | $39,345 | $45,090 |
| Interquartile 75% (IQ3) | $52,137 | $53,191 |
| Interquartile Range (IQR) | $12,792 | $8,101 |
| Standard Deviation (Sample) | $11,160 | $9,241 |
| Standard Deviation (Population) | $10,915 | $9,116 |
Similar Demographics by Median Earnings
Demographics Similar to Alsatians by Median Earnings
In terms of median earnings, the demographic groups most similar to Alsatians are Immigrants from Peru ($47,025, a difference of 0.0%), Immigrants from Eastern Africa ($46,969, a difference of 0.11%), Slovak ($47,095, a difference of 0.15%), South American Indian ($46,952, a difference of 0.15%), and Icelander ($46,916, a difference of 0.23%).
| Demographics | Rating | Rank | Median Earnings |
| Slavs | 81.1 /100 | #153 | Excellent $47,470 |
| Immigrants | Portugal | 77.3 /100 | #154 | Good $47,304 |
| Immigrants | Vietnam | 76.7 /100 | #155 | Good $47,282 |
| Irish | 76.6 /100 | #156 | Good $47,276 |
| Czechs | 75.1 /100 | #157 | Good $47,221 |
| Slovaks | 71.7 /100 | #158 | Good $47,095 |
| Immigrants | Peru | 69.6 /100 | #159 | Good $47,025 |
| Alsatians | 69.6 /100 | #160 | Good $47,023 |
| Immigrants | Eastern Africa | 68.0 /100 | #161 | Good $46,969 |
| South American Indians | 67.4 /100 | #162 | Good $46,952 |
| Icelanders | 66.3 /100 | #163 | Good $46,916 |
| Norwegians | 64.7 /100 | #164 | Good $46,865 |
| South Americans | 62.7 /100 | #165 | Good $46,804 |
| Czechoslovakians | 57.8 /100 | #166 | Average $46,658 |
| Costa Ricans | 57.4 /100 | #167 | Average $46,645 |
Demographics Similar to Immigrants from Morocco by Median Earnings
In terms of median earnings, the demographic groups most similar to Immigrants from Morocco are Immigrants from Albania ($49,377, a difference of 0.020%), Immigrants from Western Asia ($49,389, a difference of 0.040%), Immigrants from Brazil ($49,463, a difference of 0.19%), Austrian ($49,501, a difference of 0.27%), and Palestinian ($49,209, a difference of 0.32%).
| Demographics | Rating | Rank | Median Earnings |
| Immigrants | Poland | 98.9 /100 | #100 | Exceptional $49,633 |
| Jordanians | 98.9 /100 | #101 | Exceptional $49,632 |
| Ethiopians | 98.8 /100 | #102 | Exceptional $49,572 |
| Austrians | 98.7 /100 | #103 | Exceptional $49,501 |
| Immigrants | Brazil | 98.6 /100 | #104 | Exceptional $49,463 |
| Immigrants | Western Asia | 98.4 /100 | #105 | Exceptional $49,389 |
| Immigrants | Albania | 98.4 /100 | #106 | Exceptional $49,377 |
| Immigrants | Morocco | 98.4 /100 | #107 | Exceptional $49,368 |
| Palestinians | 98.0 /100 | #108 | Exceptional $49,209 |
| Syrians | 97.1 /100 | #109 | Exceptional $48,934 |
| Immigrants | Ethiopia | 97.1 /100 | #110 | Exceptional $48,924 |
| Immigrants | Zimbabwe | 97.0 /100 | #111 | Exceptional $48,913 |
| Northern Europeans | 96.9 /100 | #112 | Exceptional $48,887 |
| Immigrants | Kuwait | 96.8 /100 | #113 | Exceptional $48,861 |
| Moroccans | 96.7 /100 | #114 | Exceptional $48,838 |