Haitian vs West Indian In Labor Force | Age 35-44
COMPARE
Haitian
West Indian
In Labor Force | Age 35-44
In Labor Force | Age 35-44 Comparison
Haitians
West Indians
84.8%
IN LABOR FORCE | AGE 35-44
96.0/ 100
METRIC RATING
99th/ 347
METRIC RANK
83.9%
IN LABOR FORCE | AGE 35-44
2.4/ 100
METRIC RATING
236th/ 347
METRIC RANK
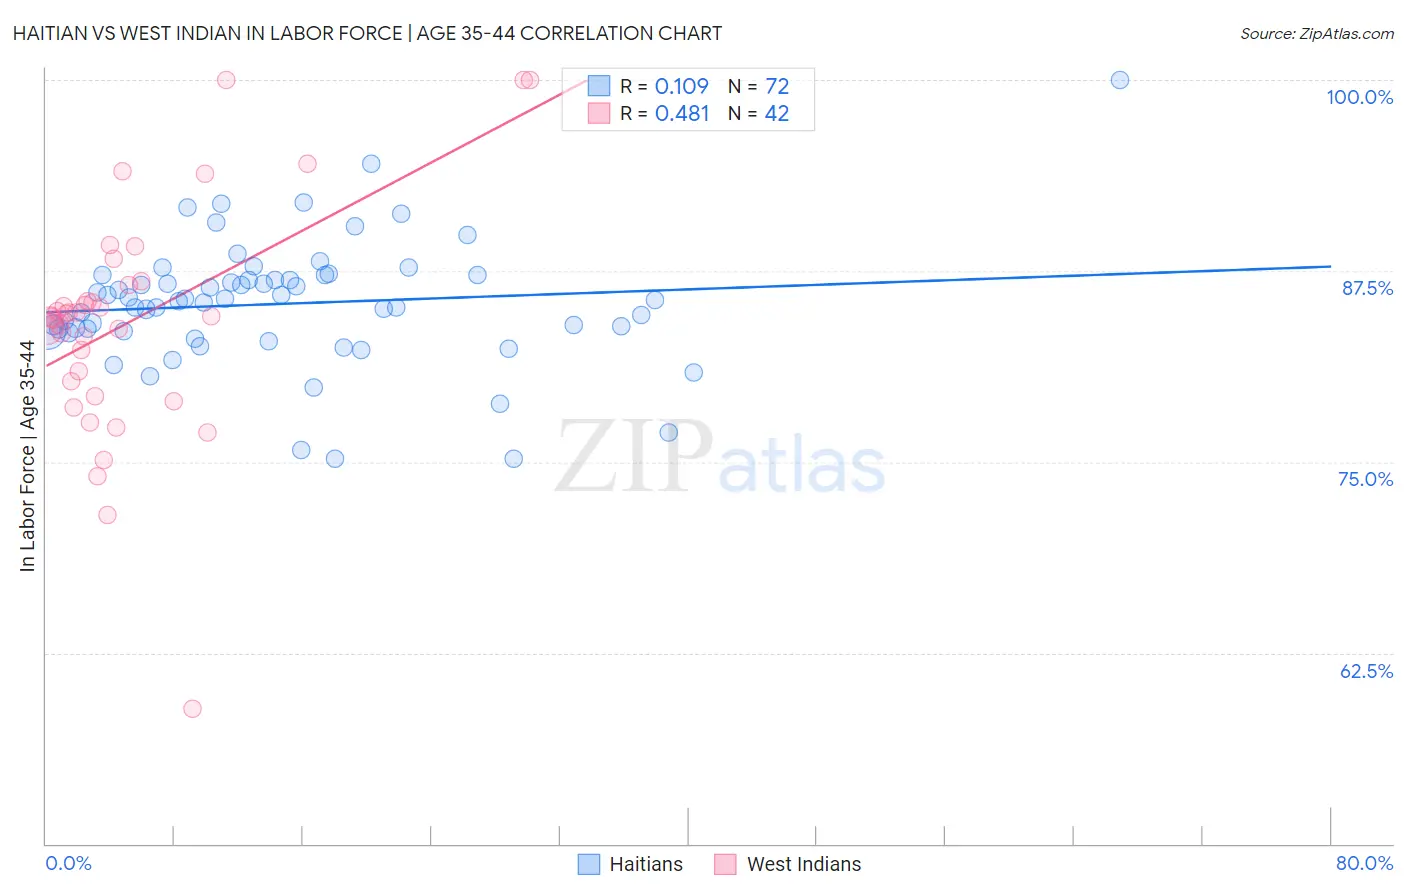
Haitian vs West Indian In Labor Force | Age 35-44 Correlation Chart
The statistical analysis conducted on geographies consisting of 287,765,256 people shows a poor positive correlation between the proportion of Haitians and labor force participation rate among population between the ages 35 and 44 in the United States with a correlation coefficient (R) of 0.109 and weighted average of 84.8%. Similarly, the statistical analysis conducted on geographies consisting of 253,906,051 people shows a moderate positive correlation between the proportion of West Indians and labor force participation rate among population between the ages 35 and 44 in the United States with a correlation coefficient (R) of 0.481 and weighted average of 83.9%, a difference of 1.1%.
In Labor Force | Age 35-44 Correlation Summary
| Measurement | Haitian | West Indian |
| Minimum | 75.2% | 58.8% |
| Maximum | 100.0% | 100.0% |
| Range | 24.8% | 41.2% |
| Mean | 85.3% | 84.2% |
| Median | 85.5% | 84.5% |
| Interquartile 25% (IQ1) | 83.6% | 80.3% |
| Interquartile 75% (IQ3) | 87.1% | 86.6% |
| Interquartile Range (IQR) | 3.5% | 6.3% |
| Standard Deviation (Sample) | 4.1% | 7.6% |
| Standard Deviation (Population) | 4.1% | 7.5% |
Similar Demographics by In Labor Force | Age 35-44
Demographics Similar to Haitians by In Labor Force | Age 35-44
In terms of in labor force | age 35-44, the demographic groups most similar to Haitians are Indian (Asian) (84.8%, a difference of 0.0%), Immigrants from Czechoslovakia (84.8%, a difference of 0.0%), Immigrants from Australia (84.8%, a difference of 0.020%), Immigrants from Southern Europe (84.8%, a difference of 0.020%), and Immigrants from Kuwait (84.8%, a difference of 0.030%).
| Demographics | Rating | Rank | In Labor Force | Age 35-44 |
| Ghanaians | 97.2 /100 | #92 | Exceptional 84.8% |
| Immigrants | Northern Africa | 97.1 /100 | #93 | Exceptional 84.8% |
| Mongolians | 96.8 /100 | #94 | Exceptional 84.8% |
| Immigrants | Kuwait | 96.7 /100 | #95 | Exceptional 84.8% |
| Cubans | 96.6 /100 | #96 | Exceptional 84.8% |
| Egyptians | 96.6 /100 | #97 | Exceptional 84.8% |
| Indians (Asian) | 96.1 /100 | #98 | Exceptional 84.8% |
| Haitians | 96.0 /100 | #99 | Exceptional 84.8% |
| Immigrants | Czechoslovakia | 95.9 /100 | #100 | Exceptional 84.8% |
| Immigrants | Australia | 95.5 /100 | #101 | Exceptional 84.8% |
| Immigrants | Southern Europe | 95.3 /100 | #102 | Exceptional 84.8% |
| Immigrants | Belarus | 95.3 /100 | #103 | Exceptional 84.8% |
| Immigrants | Sweden | 95.2 /100 | #104 | Exceptional 84.8% |
| South Americans | 95.0 /100 | #105 | Exceptional 84.8% |
| Immigrants | Bahamas | 94.8 /100 | #106 | Exceptional 84.8% |
Demographics Similar to West Indians by In Labor Force | Age 35-44
In terms of in labor force | age 35-44, the demographic groups most similar to West Indians are Immigrants from Syria (83.9%, a difference of 0.0%), Immigrants from Oceania (83.9%, a difference of 0.020%), Immigrants from Germany (83.9%, a difference of 0.030%), Native Hawaiian (83.9%, a difference of 0.040%), and English (83.8%, a difference of 0.040%).
| Demographics | Rating | Rank | In Labor Force | Age 35-44 |
| Immigrants | Thailand | 4.7 /100 | #229 | Tragic 84.0% |
| Immigrants | Iraq | 3.7 /100 | #230 | Tragic 83.9% |
| Scottish | 3.2 /100 | #231 | Tragic 83.9% |
| Native Hawaiians | 3.0 /100 | #232 | Tragic 83.9% |
| Immigrants | Germany | 2.8 /100 | #233 | Tragic 83.9% |
| Immigrants | Oceania | 2.6 /100 | #234 | Tragic 83.9% |
| Immigrants | Syria | 2.5 /100 | #235 | Tragic 83.9% |
| West Indians | 2.4 /100 | #236 | Tragic 83.9% |
| English | 1.8 /100 | #237 | Tragic 83.8% |
| Immigrants | Laos | 1.7 /100 | #238 | Tragic 83.8% |
| Celtics | 1.4 /100 | #239 | Tragic 83.8% |
| Arabs | 1.3 /100 | #240 | Tragic 83.8% |
| Iraqis | 1.3 /100 | #241 | Tragic 83.8% |
| Immigrants | Cambodia | 1.1 /100 | #242 | Tragic 83.8% |
| Immigrants | Western Asia | 1.1 /100 | #243 | Tragic 83.8% |