Guyanese vs Hawaiian Median Earnings
COMPARE
Guyanese
Hawaiian
Median Earnings
Median Earnings Comparison
Guyanese
Hawaiians
$45,470
MEDIAN EARNINGS
20.6/ 100
METRIC RATING
216th/ 347
METRIC RANK
$43,673
MEDIAN EARNINGS
2.0/ 100
METRIC RATING
252nd/ 347
METRIC RANK
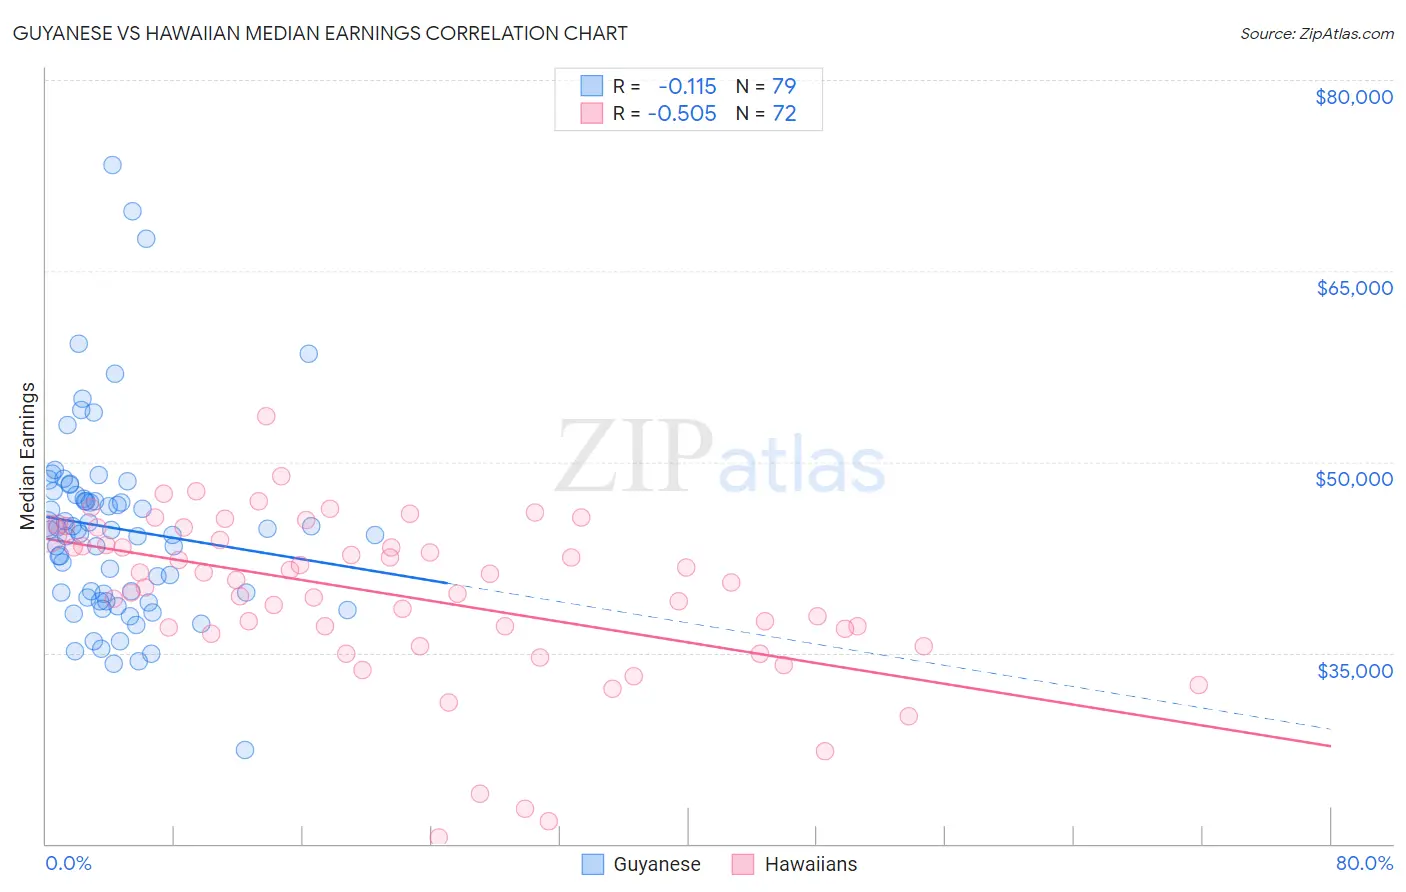
Guyanese vs Hawaiian Median Earnings Correlation Chart
The statistical analysis conducted on geographies consisting of 176,931,599 people shows a poor negative correlation between the proportion of Guyanese and median earnings in the United States with a correlation coefficient (R) of -0.115 and weighted average of $45,470. Similarly, the statistical analysis conducted on geographies consisting of 327,597,222 people shows a substantial negative correlation between the proportion of Hawaiians and median earnings in the United States with a correlation coefficient (R) of -0.505 and weighted average of $43,673, a difference of 4.1%.
Median Earnings Correlation Summary
| Measurement | Guyanese | Hawaiian |
| Minimum | $27,391 | $20,530 |
| Maximum | $73,355 | $53,613 |
| Range | $45,964 | $33,083 |
| Mean | $44,767 | $39,525 |
| Median | $44,635 | $40,637 |
| Interquartile 25% (IQ1) | $39,355 | $36,694 |
| Interquartile 75% (IQ3) | $47,401 | $44,126 |
| Interquartile Range (IQR) | $8,047 | $7,432 |
| Standard Deviation (Sample) | $7,735 | $6,473 |
| Standard Deviation (Population) | $7,686 | $6,428 |
Similar Demographics by Median Earnings
Demographics Similar to Guyanese by Median Earnings
In terms of median earnings, the demographic groups most similar to Guyanese are Tlingit-Haida ($45,468, a difference of 0.0%), Spanish ($45,432, a difference of 0.080%), Nigerian ($45,532, a difference of 0.14%), Immigrants from Bangladesh ($45,532, a difference of 0.14%), and Immigrants from Colombia ($45,550, a difference of 0.17%).
| Demographics | Rating | Rank | Median Earnings |
| Immigrants | Thailand | 23.7 /100 | #209 | Fair $45,598 |
| Immigrants | Grenada | 23.6 /100 | #210 | Fair $45,596 |
| Panamanians | 23.5 /100 | #211 | Fair $45,593 |
| Bermudans | 23.5 /100 | #212 | Fair $45,593 |
| Immigrants | Colombia | 22.4 /100 | #213 | Fair $45,550 |
| Nigerians | 22.0 /100 | #214 | Fair $45,532 |
| Immigrants | Bangladesh | 22.0 /100 | #215 | Fair $45,532 |
| Guyanese | 20.6 /100 | #216 | Fair $45,470 |
| Tlingit-Haida | 20.5 /100 | #217 | Fair $45,468 |
| Spanish | 19.7 /100 | #218 | Poor $45,432 |
| Dutch | 18.4 /100 | #219 | Poor $45,370 |
| Ecuadorians | 15.3 /100 | #220 | Poor $45,214 |
| Immigrants | Guyana | 15.1 /100 | #221 | Poor $45,204 |
| Immigrants | Panama | 15.0 /100 | #222 | Poor $45,198 |
| Whites/Caucasians | 15.0 /100 | #223 | Poor $45,197 |
Demographics Similar to Hawaiians by Median Earnings
In terms of median earnings, the demographic groups most similar to Hawaiians are Tsimshian ($43,695, a difference of 0.050%), Alaska Native ($43,750, a difference of 0.18%), Somali ($43,567, a difference of 0.24%), Liberian ($43,536, a difference of 0.31%), and Malaysian ($43,844, a difference of 0.39%).
| Demographics | Rating | Rank | Median Earnings |
| Immigrants | Burma/Myanmar | 3.2 /100 | #245 | Tragic $43,998 |
| Immigrants | West Indies | 3.1 /100 | #246 | Tragic $43,989 |
| Immigrants | Cabo Verde | 3.0 /100 | #247 | Tragic $43,963 |
| Nepalese | 2.6 /100 | #248 | Tragic $43,860 |
| Malaysians | 2.6 /100 | #249 | Tragic $43,844 |
| Alaska Natives | 2.3 /100 | #250 | Tragic $43,750 |
| Tsimshian | 2.1 /100 | #251 | Tragic $43,695 |
| Hawaiians | 2.0 /100 | #252 | Tragic $43,673 |
| Somalis | 1.8 /100 | #253 | Tragic $43,567 |
| Liberians | 1.7 /100 | #254 | Tragic $43,536 |
| Immigrants | Middle Africa | 1.4 /100 | #255 | Tragic $43,416 |
| Alaskan Athabascans | 1.4 /100 | #256 | Tragic $43,393 |
| Jamaicans | 1.3 /100 | #257 | Tragic $43,343 |
| French American Indians | 1.3 /100 | #258 | Tragic $43,333 |
| German Russians | 1.1 /100 | #259 | Tragic $43,200 |