Guyanese vs Immigrants from Australia Median Earnings
COMPARE
Guyanese
Immigrants from Australia
Median Earnings
Median Earnings Comparison
Guyanese
Immigrants from Australia
$45,470
MEDIAN EARNINGS
20.6/ 100
METRIC RATING
216th/ 347
METRIC RANK
$56,305
MEDIAN EARNINGS
100.0/ 100
METRIC RATING
14th/ 347
METRIC RANK
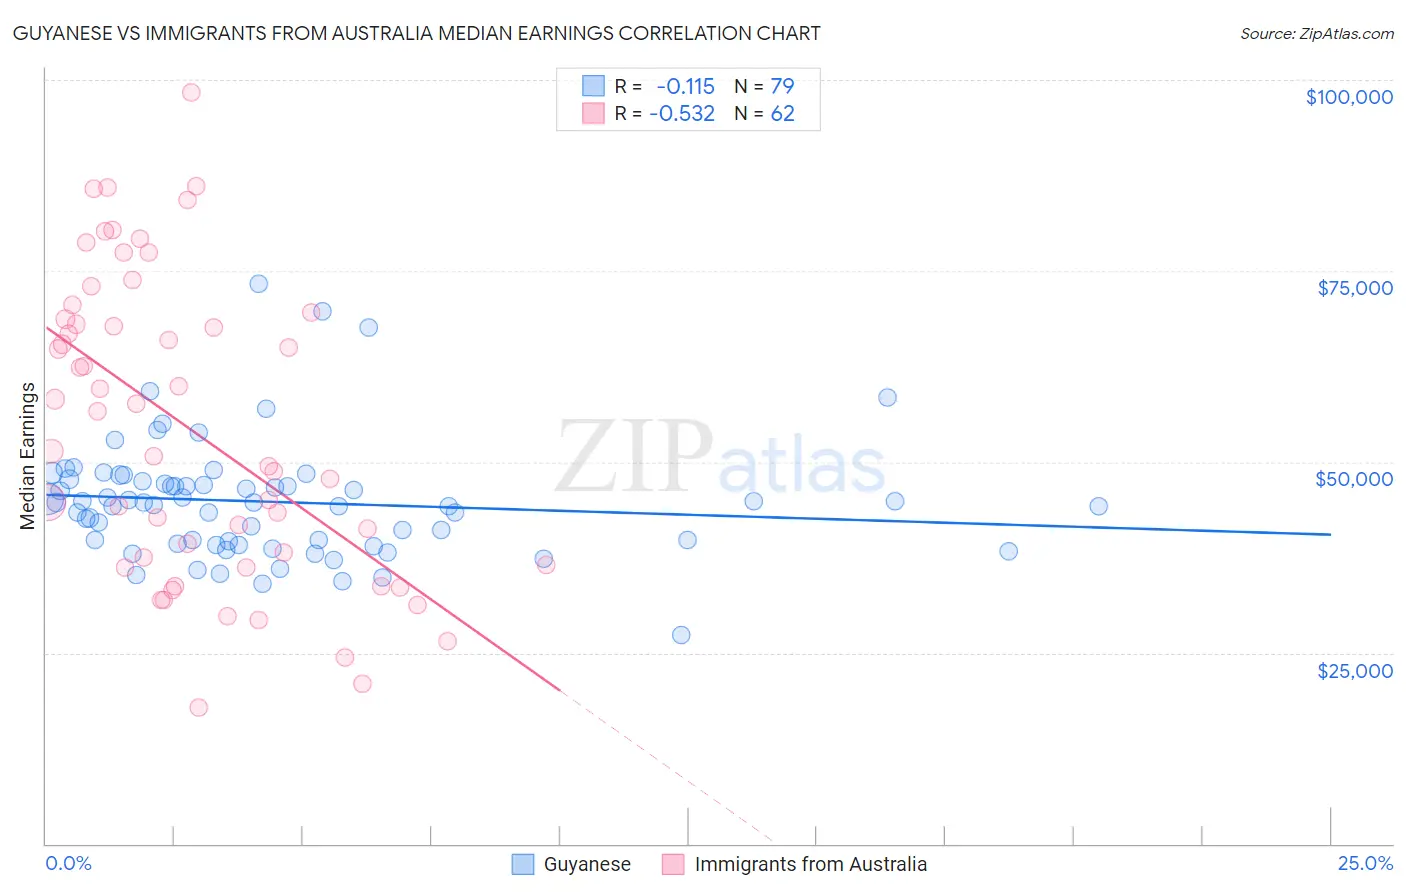
Guyanese vs Immigrants from Australia Median Earnings Correlation Chart
The statistical analysis conducted on geographies consisting of 176,931,599 people shows a poor negative correlation between the proportion of Guyanese and median earnings in the United States with a correlation coefficient (R) of -0.115 and weighted average of $45,470. Similarly, the statistical analysis conducted on geographies consisting of 227,197,451 people shows a substantial negative correlation between the proportion of Immigrants from Australia and median earnings in the United States with a correlation coefficient (R) of -0.532 and weighted average of $56,305, a difference of 23.8%.
Median Earnings Correlation Summary
| Measurement | Guyanese | Immigrants from Australia |
| Minimum | $27,391 | $17,795 |
| Maximum | $73,355 | $98,400 |
| Range | $45,964 | $80,605 |
| Mean | $44,767 | $54,359 |
| Median | $44,635 | $54,001 |
| Interquartile 25% (IQ1) | $39,355 | $36,563 |
| Interquartile 75% (IQ3) | $47,401 | $68,667 |
| Interquartile Range (IQR) | $8,047 | $32,104 |
| Standard Deviation (Sample) | $7,735 | $19,682 |
| Standard Deviation (Population) | $7,686 | $19,523 |
Similar Demographics by Median Earnings
Demographics Similar to Guyanese by Median Earnings
In terms of median earnings, the demographic groups most similar to Guyanese are Tlingit-Haida ($45,468, a difference of 0.0%), Spanish ($45,432, a difference of 0.080%), Nigerian ($45,532, a difference of 0.14%), Immigrants from Bangladesh ($45,532, a difference of 0.14%), and Immigrants from Colombia ($45,550, a difference of 0.17%).
| Demographics | Rating | Rank | Median Earnings |
| Immigrants | Thailand | 23.7 /100 | #209 | Fair $45,598 |
| Immigrants | Grenada | 23.6 /100 | #210 | Fair $45,596 |
| Panamanians | 23.5 /100 | #211 | Fair $45,593 |
| Bermudans | 23.5 /100 | #212 | Fair $45,593 |
| Immigrants | Colombia | 22.4 /100 | #213 | Fair $45,550 |
| Nigerians | 22.0 /100 | #214 | Fair $45,532 |
| Immigrants | Bangladesh | 22.0 /100 | #215 | Fair $45,532 |
| Guyanese | 20.6 /100 | #216 | Fair $45,470 |
| Tlingit-Haida | 20.5 /100 | #217 | Fair $45,468 |
| Spanish | 19.7 /100 | #218 | Poor $45,432 |
| Dutch | 18.4 /100 | #219 | Poor $45,370 |
| Ecuadorians | 15.3 /100 | #220 | Poor $45,214 |
| Immigrants | Guyana | 15.1 /100 | #221 | Poor $45,204 |
| Immigrants | Panama | 15.0 /100 | #222 | Poor $45,198 |
| Whites/Caucasians | 15.0 /100 | #223 | Poor $45,197 |
Demographics Similar to Immigrants from Australia by Median Earnings
In terms of median earnings, the demographic groups most similar to Immigrants from Australia are Indian (Asian) ($56,253, a difference of 0.090%), Immigrants from Eastern Asia ($56,183, a difference of 0.22%), Immigrants from China ($56,638, a difference of 0.59%), Immigrants from Ireland ($56,854, a difference of 0.97%), and Immigrants from Israel ($57,034, a difference of 1.3%).
| Demographics | Rating | Rank | Median Earnings |
| Iranians | 100.0 /100 | #7 | Exceptional $58,474 |
| Immigrants | Iran | 100.0 /100 | #8 | Exceptional $57,612 |
| Okinawans | 100.0 /100 | #9 | Exceptional $57,550 |
| Immigrants | South Central Asia | 100.0 /100 | #10 | Exceptional $57,114 |
| Immigrants | Israel | 100.0 /100 | #11 | Exceptional $57,034 |
| Immigrants | Ireland | 100.0 /100 | #12 | Exceptional $56,854 |
| Immigrants | China | 100.0 /100 | #13 | Exceptional $56,638 |
| Immigrants | Australia | 100.0 /100 | #14 | Exceptional $56,305 |
| Indians (Asian) | 100.0 /100 | #15 | Exceptional $56,253 |
| Immigrants | Eastern Asia | 100.0 /100 | #16 | Exceptional $56,183 |
| Eastern Europeans | 100.0 /100 | #17 | Exceptional $55,084 |
| Immigrants | Japan | 100.0 /100 | #18 | Exceptional $54,938 |
| Immigrants | Belgium | 100.0 /100 | #19 | Exceptional $54,679 |
| Cypriots | 100.0 /100 | #20 | Exceptional $54,589 |
| Burmese | 100.0 /100 | #21 | Exceptional $54,559 |