Guyanese vs Potawatomi Median Earnings
COMPARE
Guyanese
Potawatomi
Median Earnings
Median Earnings Comparison
Guyanese
Potawatomi
$45,470
MEDIAN EARNINGS
20.6/ 100
METRIC RATING
216th/ 347
METRIC RANK
$41,288
MEDIAN EARNINGS
0.1/ 100
METRIC RATING
294th/ 347
METRIC RANK
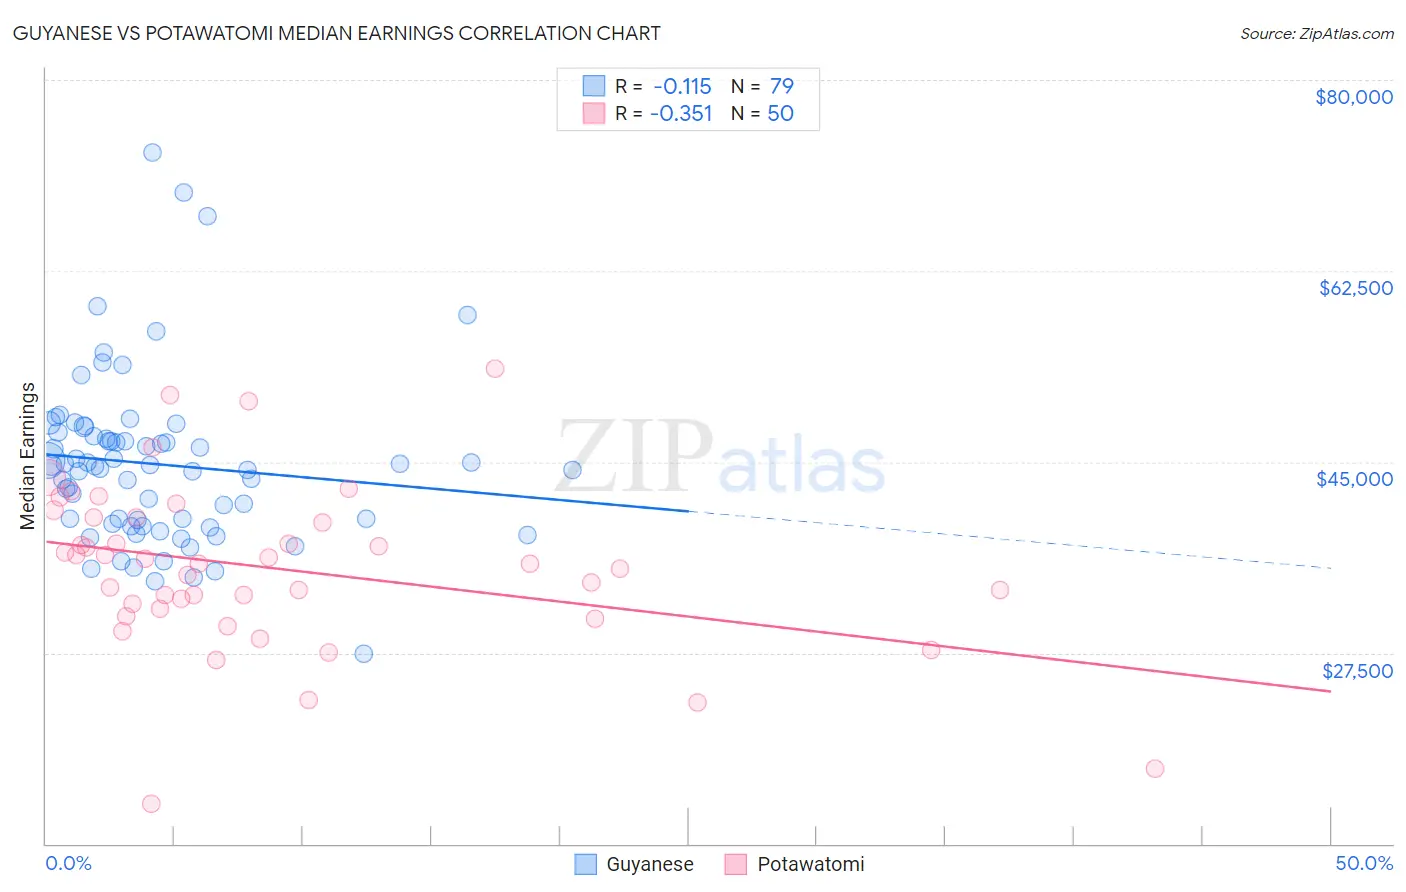
Guyanese vs Potawatomi Median Earnings Correlation Chart
The statistical analysis conducted on geographies consisting of 176,931,599 people shows a poor negative correlation between the proportion of Guyanese and median earnings in the United States with a correlation coefficient (R) of -0.115 and weighted average of $45,470. Similarly, the statistical analysis conducted on geographies consisting of 117,770,629 people shows a mild negative correlation between the proportion of Potawatomi and median earnings in the United States with a correlation coefficient (R) of -0.351 and weighted average of $41,288, a difference of 10.1%.
Median Earnings Correlation Summary
| Measurement | Guyanese | Potawatomi |
| Minimum | $27,391 | $13,611 |
| Maximum | $73,355 | $53,523 |
| Range | $45,964 | $39,912 |
| Mean | $44,767 | $35,226 |
| Median | $44,635 | $35,630 |
| Interquartile 25% (IQ1) | $39,355 | $31,586 |
| Interquartile 75% (IQ3) | $47,401 | $39,871 |
| Interquartile Range (IQR) | $8,047 | $8,285 |
| Standard Deviation (Sample) | $7,735 | $7,629 |
| Standard Deviation (Population) | $7,686 | $7,552 |
Similar Demographics by Median Earnings
Demographics Similar to Guyanese by Median Earnings
In terms of median earnings, the demographic groups most similar to Guyanese are Tlingit-Haida ($45,468, a difference of 0.0%), Spanish ($45,432, a difference of 0.080%), Nigerian ($45,532, a difference of 0.14%), Immigrants from Bangladesh ($45,532, a difference of 0.14%), and Immigrants from Colombia ($45,550, a difference of 0.17%).
| Demographics | Rating | Rank | Median Earnings |
| Immigrants | Thailand | 23.7 /100 | #209 | Fair $45,598 |
| Immigrants | Grenada | 23.6 /100 | #210 | Fair $45,596 |
| Panamanians | 23.5 /100 | #211 | Fair $45,593 |
| Bermudans | 23.5 /100 | #212 | Fair $45,593 |
| Immigrants | Colombia | 22.4 /100 | #213 | Fair $45,550 |
| Nigerians | 22.0 /100 | #214 | Fair $45,532 |
| Immigrants | Bangladesh | 22.0 /100 | #215 | Fair $45,532 |
| Guyanese | 20.6 /100 | #216 | Fair $45,470 |
| Tlingit-Haida | 20.5 /100 | #217 | Fair $45,468 |
| Spanish | 19.7 /100 | #218 | Poor $45,432 |
| Dutch | 18.4 /100 | #219 | Poor $45,370 |
| Ecuadorians | 15.3 /100 | #220 | Poor $45,214 |
| Immigrants | Guyana | 15.1 /100 | #221 | Poor $45,204 |
| Immigrants | Panama | 15.0 /100 | #222 | Poor $45,198 |
| Whites/Caucasians | 15.0 /100 | #223 | Poor $45,197 |
Demographics Similar to Potawatomi by Median Earnings
In terms of median earnings, the demographic groups most similar to Potawatomi are Bangladeshi ($41,263, a difference of 0.060%), Immigrants from Zaire ($41,325, a difference of 0.090%), Cherokee ($41,252, a difference of 0.090%), Guatemalan ($41,205, a difference of 0.20%), and Immigrants from Micronesia ($41,133, a difference of 0.38%).
| Demographics | Rating | Rank | Median Earnings |
| Indonesians | 0.1 /100 | #287 | Tragic $41,701 |
| Immigrants | Dominican Republic | 0.1 /100 | #288 | Tragic $41,554 |
| Comanche | 0.1 /100 | #289 | Tragic $41,519 |
| Paiute | 0.1 /100 | #290 | Tragic $41,508 |
| Central American Indians | 0.1 /100 | #291 | Tragic $41,474 |
| U.S. Virgin Islanders | 0.1 /100 | #292 | Tragic $41,448 |
| Immigrants | Zaire | 0.1 /100 | #293 | Tragic $41,325 |
| Potawatomi | 0.1 /100 | #294 | Tragic $41,288 |
| Bangladeshis | 0.1 /100 | #295 | Tragic $41,263 |
| Cherokee | 0.1 /100 | #296 | Tragic $41,252 |
| Guatemalans | 0.1 /100 | #297 | Tragic $41,205 |
| Immigrants | Micronesia | 0.1 /100 | #298 | Tragic $41,133 |
| Immigrants | Caribbean | 0.1 /100 | #299 | Tragic $41,119 |
| Ute | 0.1 /100 | #300 | Tragic $41,051 |
| Immigrants | Latin America | 0.1 /100 | #301 | Tragic $41,049 |