Guatemalan vs South American Disability Age 5 to 17
COMPARE
Guatemalan
South American
Disability Age 5 to 17
Disability Age 5 to 17 Comparison
Guatemalans
South Americans
5.5%
DISABILITY AGE 5 TO 17
81.5/ 100
METRIC RATING
150th/ 347
METRIC RANK
5.4%
DISABILITY AGE 5 TO 17
97.1/ 100
METRIC RATING
118th/ 347
METRIC RANK
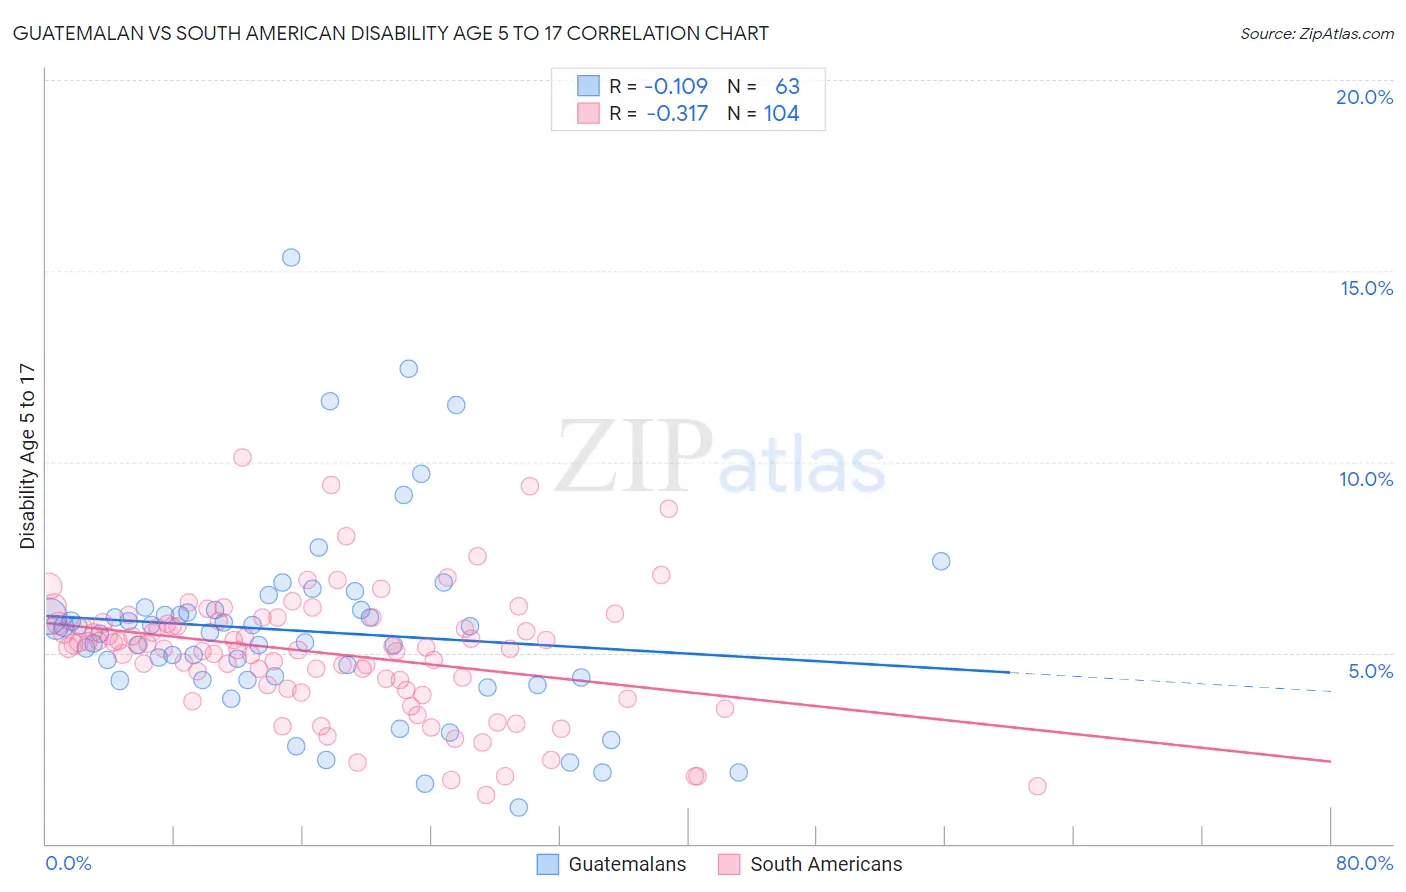
Guatemalan vs South American Disability Age 5 to 17 Correlation Chart
The statistical analysis conducted on geographies consisting of 406,988,204 people shows a poor negative correlation between the proportion of Guatemalans and percentage of population with a disability between the ages 5 and 17 in the United States with a correlation coefficient (R) of -0.109 and weighted average of 5.5%. Similarly, the statistical analysis conducted on geographies consisting of 487,738,327 people shows a mild negative correlation between the proportion of South Americans and percentage of population with a disability between the ages 5 and 17 in the United States with a correlation coefficient (R) of -0.317 and weighted average of 5.4%, a difference of 2.6%.
Disability Age 5 to 17 Correlation Summary
| Measurement | Guatemalan | South American |
| Minimum | 0.96% | 1.3% |
| Maximum | 15.4% | 10.1% |
| Range | 14.4% | 8.8% |
| Mean | 5.6% | 5.0% |
| Median | 5.5% | 5.2% |
| Interquartile 25% (IQ1) | 4.3% | 4.1% |
| Interquartile 75% (IQ3) | 6.1% | 5.8% |
| Interquartile Range (IQR) | 1.8% | 1.7% |
| Standard Deviation (Sample) | 2.5% | 1.6% |
| Standard Deviation (Population) | 2.5% | 1.6% |
Similar Demographics by Disability Age 5 to 17
Demographics Similar to Guatemalans by Disability Age 5 to 17
In terms of disability age 5 to 17, the demographic groups most similar to Guatemalans are Central American (5.5%, a difference of 0.0%), Samoan (5.5%, a difference of 0.030%), Estonian (5.5%, a difference of 0.060%), Ute (5.5%, a difference of 0.070%), and Immigrants from Albania (5.5%, a difference of 0.13%).
| Demographics | Rating | Rank | Disability Age 5 to 17 |
| Immigrants | Hungary | 87.9 /100 | #143 | Excellent 5.5% |
| Pakistanis | 87.3 /100 | #144 | Excellent 5.5% |
| Immigrants | Guatemala | 86.6 /100 | #145 | Excellent 5.5% |
| Albanians | 83.7 /100 | #146 | Excellent 5.5% |
| Immigrants | Albania | 83.1 /100 | #147 | Excellent 5.5% |
| Samoans | 81.9 /100 | #148 | Excellent 5.5% |
| Central Americans | 81.6 /100 | #149 | Excellent 5.5% |
| Guatemalans | 81.5 /100 | #150 | Excellent 5.5% |
| Estonians | 80.8 /100 | #151 | Excellent 5.5% |
| Ute | 80.6 /100 | #152 | Excellent 5.5% |
| Ecuadorians | 79.7 /100 | #153 | Good 5.5% |
| Australians | 78.8 /100 | #154 | Good 5.5% |
| Immigrants | Ecuador | 78.3 /100 | #155 | Good 5.5% |
| Hawaiians | 78.0 /100 | #156 | Good 5.5% |
| Immigrants | Costa Rica | 77.9 /100 | #157 | Good 5.5% |
Demographics Similar to South Americans by Disability Age 5 to 17
In terms of disability age 5 to 17, the demographic groups most similar to South Americans are Immigrants from South America (5.4%, a difference of 0.010%), Immigrants (5.4%, a difference of 0.060%), Immigrants from Afghanistan (5.3%, a difference of 0.11%), Cypriot (5.3%, a difference of 0.27%), and Cuban (5.3%, a difference of 0.33%).
| Demographics | Rating | Rank | Disability Age 5 to 17 |
| Ethiopians | 97.9 /100 | #111 | Exceptional 5.3% |
| Immigrants | Latvia | 97.9 /100 | #112 | Exceptional 5.3% |
| Aleuts | 97.8 /100 | #113 | Exceptional 5.3% |
| Immigrants | Northern Europe | 97.8 /100 | #114 | Exceptional 5.3% |
| Cubans | 97.8 /100 | #115 | Exceptional 5.3% |
| Cypriots | 97.7 /100 | #116 | Exceptional 5.3% |
| Immigrants | Afghanistan | 97.4 /100 | #117 | Exceptional 5.3% |
| South Americans | 97.1 /100 | #118 | Exceptional 5.4% |
| Immigrants | South America | 97.1 /100 | #119 | Exceptional 5.4% |
| Immigrants | Immigrants | 97.0 /100 | #120 | Exceptional 5.4% |
| Maltese | 96.0 /100 | #121 | Exceptional 5.4% |
| Chileans | 95.8 /100 | #122 | Exceptional 5.4% |
| Immigrants | Ethiopia | 95.5 /100 | #123 | Exceptional 5.4% |
| Crow | 95.0 /100 | #124 | Exceptional 5.4% |
| Immigrants | Chile | 95.0 /100 | #125 | Exceptional 5.4% |