Immigrants from Afghanistan vs Pakistani Median Family Income
COMPARE
Immigrants from Afghanistan
Pakistani
Median Family Income
Median Family Income Comparison
Immigrants from Afghanistan
Pakistanis
$108,709
MEDIAN FAMILY INCOME
95.6/ 100
METRIC RATING
109th/ 347
METRIC RANK
$107,390
MEDIAN FAMILY INCOME
91.7/ 100
METRIC RATING
124th/ 347
METRIC RANK
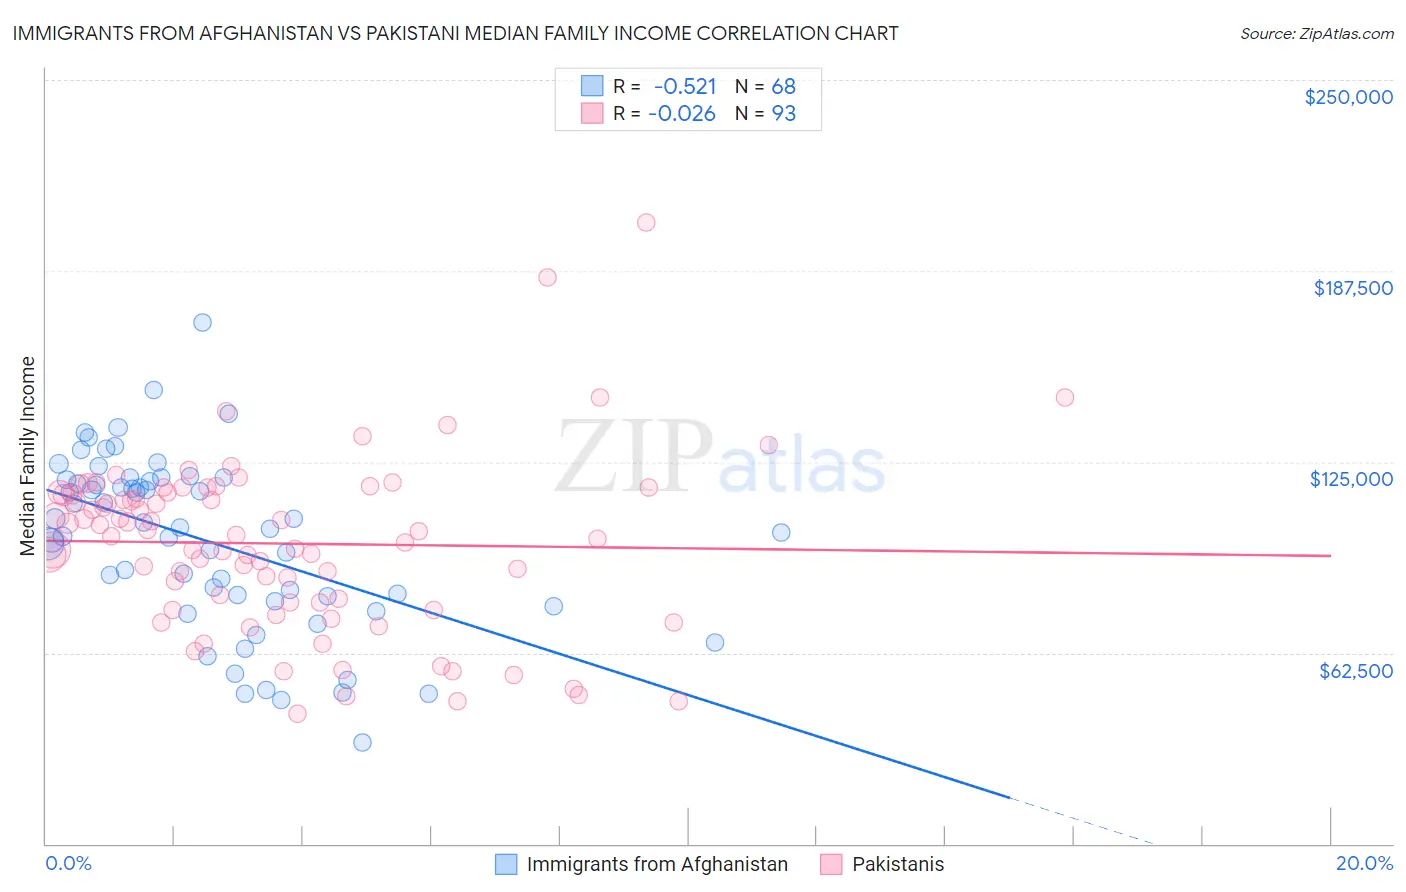
Immigrants from Afghanistan vs Pakistani Median Family Income Correlation Chart
The statistical analysis conducted on geographies consisting of 147,629,265 people shows a substantial negative correlation between the proportion of Immigrants from Afghanistan and median family income in the United States with a correlation coefficient (R) of -0.521 and weighted average of $108,709. Similarly, the statistical analysis conducted on geographies consisting of 335,122,769 people shows no correlation between the proportion of Pakistanis and median family income in the United States with a correlation coefficient (R) of -0.026 and weighted average of $107,390, a difference of 1.2%.
Median Family Income Correlation Summary
| Measurement | Immigrants from Afghanistan | Pakistani |
| Minimum | $33,250 | $42,414 |
| Maximum | $170,486 | $203,281 |
| Range | $137,236 | $160,867 |
| Mean | $99,044 | $98,287 |
| Median | $103,312 | $101,250 |
| Interquartile 25% (IQ1) | $80,208 | $78,908 |
| Interquartile 75% (IQ3) | $118,974 | $114,990 |
| Interquartile Range (IQR) | $38,766 | $36,082 |
| Standard Deviation (Sample) | $28,337 | $28,141 |
| Standard Deviation (Population) | $28,128 | $27,989 |
Demographics Similar to Immigrants from Afghanistan and Pakistanis by Median Family Income
In terms of median family income, the demographic groups most similar to Immigrants from Afghanistan are British ($108,705, a difference of 0.0%), Immigrants from Western Asia ($108,691, a difference of 0.020%), Immigrants from Zimbabwe ($108,830, a difference of 0.11%), Immigrants from Poland ($108,570, a difference of 0.13%), and Immigrants from Saudi Arabia ($108,544, a difference of 0.15%). Similarly, the demographic groups most similar to Pakistanis are Taiwanese ($107,295, a difference of 0.090%), Carpatho Rusyn ($107,502, a difference of 0.11%), Serbian ($107,157, a difference of 0.22%), Immigrants from Jordan ($107,715, a difference of 0.30%), and European ($108,099, a difference of 0.66%).
| Demographics | Rating | Rank | Median Family Income |
| Albanians | 96.4 /100 | #106 | Exceptional $109,136 |
| Immigrants | North Macedonia | 96.4 /100 | #107 | Exceptional $109,136 |
| Immigrants | Zimbabwe | 95.9 /100 | #108 | Exceptional $108,830 |
| Immigrants | Afghanistan | 95.6 /100 | #109 | Exceptional $108,709 |
| British | 95.6 /100 | #110 | Exceptional $108,705 |
| Immigrants | Western Asia | 95.6 /100 | #111 | Exceptional $108,691 |
| Immigrants | Poland | 95.3 /100 | #112 | Exceptional $108,570 |
| Immigrants | Saudi Arabia | 95.2 /100 | #113 | Exceptional $108,544 |
| Poles | 95.2 /100 | #114 | Exceptional $108,507 |
| Swedes | 95.1 /100 | #115 | Exceptional $108,499 |
| Chileans | 95.0 /100 | #116 | Exceptional $108,429 |
| Immigrants | Philippines | 94.6 /100 | #117 | Exceptional $108,288 |
| Ethiopians | 94.5 /100 | #118 | Exceptional $108,251 |
| Sri Lankans | 94.5 /100 | #119 | Exceptional $108,234 |
| Immigrants | Northern Africa | 94.3 /100 | #120 | Exceptional $108,161 |
| Europeans | 94.1 /100 | #121 | Exceptional $108,099 |
| Immigrants | Jordan | 92.9 /100 | #122 | Exceptional $107,715 |
| Carpatho Rusyns | 92.2 /100 | #123 | Exceptional $107,502 |
| Pakistanis | 91.7 /100 | #124 | Exceptional $107,390 |
| Taiwanese | 91.4 /100 | #125 | Exceptional $107,295 |
| Serbians | 90.8 /100 | #126 | Exceptional $107,157 |