Guatemalan vs Pakistani Female Disability
COMPARE
Guatemalan
Pakistani
Female Disability
Female Disability Comparison
Guatemalans
Pakistanis
12.1%
FEMALE DISABILITY
63.8/ 100
METRIC RATING
163rd/ 347
METRIC RANK
12.0%
FEMALE DISABILITY
84.6/ 100
METRIC RATING
146th/ 347
METRIC RANK
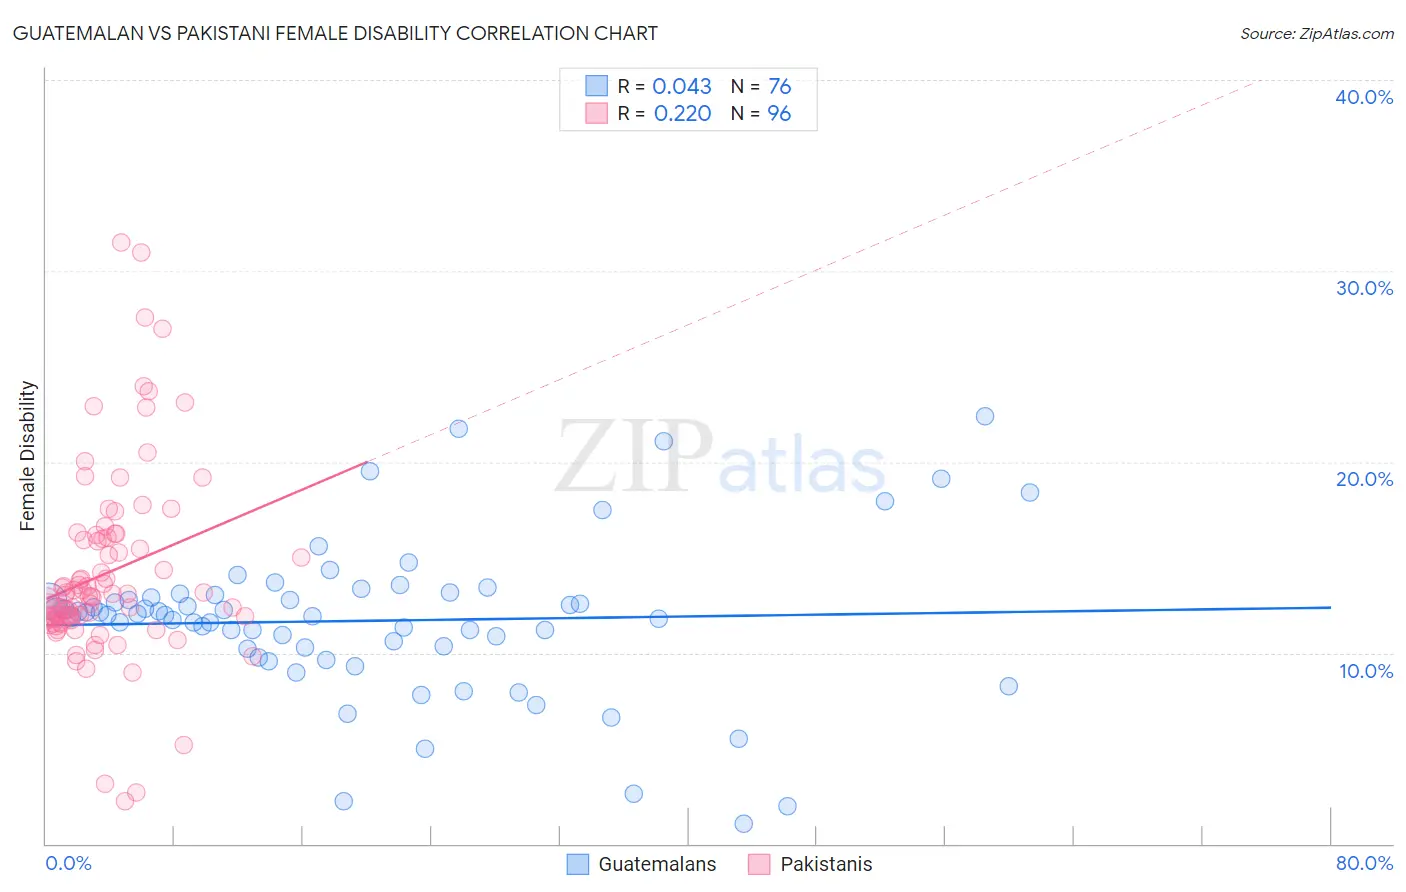
Guatemalan vs Pakistani Female Disability Correlation Chart
The statistical analysis conducted on geographies consisting of 409,476,424 people shows no correlation between the proportion of Guatemalans and percentage of females with a disability in the United States with a correlation coefficient (R) of 0.043 and weighted average of 12.1%. Similarly, the statistical analysis conducted on geographies consisting of 335,294,894 people shows a weak positive correlation between the proportion of Pakistanis and percentage of females with a disability in the United States with a correlation coefficient (R) of 0.220 and weighted average of 12.0%, a difference of 1.1%.
Female Disability Correlation Summary
| Measurement | Guatemalan | Pakistani |
| Minimum | 1.0% | 2.2% |
| Maximum | 22.4% | 31.5% |
| Range | 21.4% | 29.3% |
| Mean | 11.7% | 14.2% |
| Median | 12.0% | 13.0% |
| Interquartile 25% (IQ1) | 10.2% | 11.7% |
| Interquartile 75% (IQ3) | 13.0% | 16.0% |
| Interquartile Range (IQR) | 2.7% | 4.3% |
| Standard Deviation (Sample) | 4.0% | 5.0% |
| Standard Deviation (Population) | 4.0% | 5.0% |
Demographics Similar to Guatemalans and Pakistanis by Female Disability
In terms of female disability, the demographic groups most similar to Guatemalans are Czech (12.1%, a difference of 0.010%), Immigrants from Ukraine (12.1%, a difference of 0.020%), Guyanese (12.1%, a difference of 0.030%), Immigrants from Guatemala (12.1%, a difference of 0.090%), and Immigrants from Central America (12.1%, a difference of 0.16%). Similarly, the demographic groups most similar to Pakistanis are Nigerian (12.0%, a difference of 0.040%), Immigrants from Kenya (12.0%, a difference of 0.11%), Greek (12.0%, a difference of 0.18%), Immigrants from Moldova (12.0%, a difference of 0.21%), and Estonian (12.0%, a difference of 0.26%).
| Demographics | Rating | Rank | Female Disability |
| Immigrants | Austria | 87.9 /100 | #144 | Excellent 12.0% |
| Estonians | 87.8 /100 | #145 | Excellent 12.0% |
| Pakistanis | 84.6 /100 | #146 | Excellent 12.0% |
| Nigerians | 84.0 /100 | #147 | Excellent 12.0% |
| Immigrants | Kenya | 83.1 /100 | #148 | Excellent 12.0% |
| Greeks | 82.0 /100 | #149 | Excellent 12.0% |
| Immigrants | Moldova | 81.4 /100 | #150 | Excellent 12.0% |
| Icelanders | 80.7 /100 | #151 | Excellent 12.0% |
| Immigrants | Scotland | 79.3 /100 | #152 | Good 12.0% |
| Sudanese | 79.1 /100 | #153 | Good 12.0% |
| Syrians | 76.9 /100 | #154 | Good 12.1% |
| Ghanaians | 76.6 /100 | #155 | Good 12.1% |
| Moroccans | 72.9 /100 | #156 | Good 12.1% |
| Danes | 72.5 /100 | #157 | Good 12.1% |
| Immigrants | Middle Africa | 72.4 /100 | #158 | Good 12.1% |
| Immigrants | Central America | 67.7 /100 | #159 | Good 12.1% |
| Immigrants | Guatemala | 66.0 /100 | #160 | Good 12.1% |
| Guyanese | 64.7 /100 | #161 | Good 12.1% |
| Immigrants | Ukraine | 64.3 /100 | #162 | Good 12.1% |
| Guatemalans | 63.8 /100 | #163 | Good 12.1% |
| Czechs | 63.6 /100 | #164 | Good 12.1% |