Peruvian vs Immigrants from Switzerland Median Earnings
COMPARE
Peruvian
Immigrants from Switzerland
Median Earnings
Median Earnings Comparison
Peruvians
Immigrants from Switzerland
$47,628
MEDIAN EARNINGS
84.2/ 100
METRIC RATING
150th/ 347
METRIC RANK
$53,211
MEDIAN EARNINGS
100.0/ 100
METRIC RATING
35th/ 347
METRIC RANK
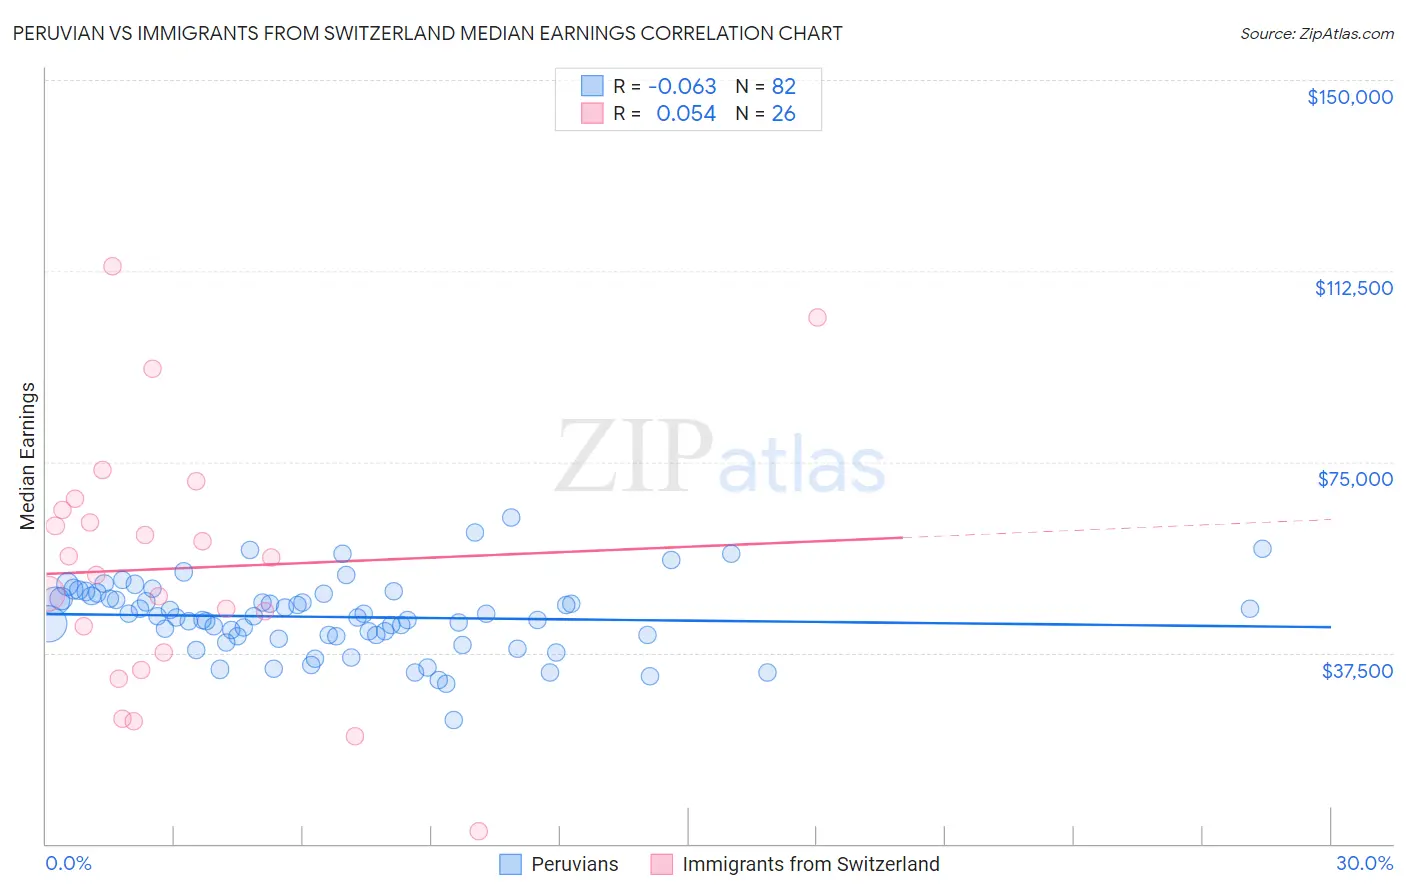
Peruvian vs Immigrants from Switzerland Median Earnings Correlation Chart
The statistical analysis conducted on geographies consisting of 363,247,580 people shows a slight negative correlation between the proportion of Peruvians and median earnings in the United States with a correlation coefficient (R) of -0.063 and weighted average of $47,628. Similarly, the statistical analysis conducted on geographies consisting of 148,076,857 people shows a slight positive correlation between the proportion of Immigrants from Switzerland and median earnings in the United States with a correlation coefficient (R) of 0.054 and weighted average of $53,211, a difference of 11.7%.
Median Earnings Correlation Summary
| Measurement | Peruvian | Immigrants from Switzerland |
| Minimum | $24,212 | $2,499 |
| Maximum | $64,091 | $113,419 |
| Range | $39,879 | $110,920 |
| Mean | $44,547 | $54,118 |
| Median | $44,525 | $54,480 |
| Interquartile 25% (IQ1) | $40,828 | $37,656 |
| Interquartile 75% (IQ3) | $48,604 | $65,606 |
| Interquartile Range (IQR) | $7,775 | $27,950 |
| Standard Deviation (Sample) | $7,153 | $25,059 |
| Standard Deviation (Population) | $7,110 | $24,573 |
Similar Demographics by Median Earnings
Demographics Similar to Peruvians by Median Earnings
In terms of median earnings, the demographic groups most similar to Peruvians are Luxembourger ($47,640, a difference of 0.020%), Immigrants from Oceania ($47,617, a difference of 0.020%), Immigrants from Eritrea ($47,657, a difference of 0.060%), Immigrants from South Eastern Asia ($47,671, a difference of 0.090%), and Immigrants from Germany ($47,566, a difference of 0.13%).
| Demographics | Rating | Rank | Median Earnings |
| Swedes | 88.0 /100 | #143 | Excellent $47,851 |
| Hungarians | 87.1 /100 | #144 | Excellent $47,795 |
| Immigrants | Saudi Arabia | 85.6 /100 | #145 | Excellent $47,704 |
| Immigrants | Chile | 85.5 /100 | #146 | Excellent $47,697 |
| Immigrants | South Eastern Asia | 85.0 /100 | #147 | Excellent $47,671 |
| Immigrants | Eritrea | 84.8 /100 | #148 | Excellent $47,657 |
| Luxembourgers | 84.5 /100 | #149 | Excellent $47,640 |
| Peruvians | 84.2 /100 | #150 | Excellent $47,628 |
| Immigrants | Oceania | 84.1 /100 | #151 | Excellent $47,617 |
| Immigrants | Germany | 83.1 /100 | #152 | Excellent $47,566 |
| Slavs | 81.1 /100 | #153 | Excellent $47,470 |
| Immigrants | Portugal | 77.3 /100 | #154 | Good $47,304 |
| Immigrants | Vietnam | 76.7 /100 | #155 | Good $47,282 |
| Irish | 76.6 /100 | #156 | Good $47,276 |
| Czechs | 75.1 /100 | #157 | Good $47,221 |
Demographics Similar to Immigrants from Switzerland by Median Earnings
In terms of median earnings, the demographic groups most similar to Immigrants from Switzerland are Immigrants from Denmark ($53,186, a difference of 0.050%), Immigrants from Sri Lanka ($53,268, a difference of 0.11%), Immigrants from Greece ($53,282, a difference of 0.13%), Immigrants from Asia ($53,310, a difference of 0.19%), and Russian ($53,334, a difference of 0.23%).
| Demographics | Rating | Rank | Median Earnings |
| Immigrants | France | 100.0 /100 | #28 | Exceptional $53,490 |
| Immigrants | Russia | 100.0 /100 | #29 | Exceptional $53,457 |
| Cambodians | 100.0 /100 | #30 | Exceptional $53,386 |
| Russians | 100.0 /100 | #31 | Exceptional $53,334 |
| Immigrants | Asia | 100.0 /100 | #32 | Exceptional $53,310 |
| Immigrants | Greece | 100.0 /100 | #33 | Exceptional $53,282 |
| Immigrants | Sri Lanka | 100.0 /100 | #34 | Exceptional $53,268 |
| Immigrants | Switzerland | 100.0 /100 | #35 | Exceptional $53,211 |
| Immigrants | Denmark | 100.0 /100 | #36 | Exceptional $53,186 |
| Immigrants | Belarus | 100.0 /100 | #37 | Exceptional $53,043 |
| Latvians | 100.0 /100 | #38 | Exceptional $53,001 |
| Immigrants | Turkey | 100.0 /100 | #39 | Exceptional $52,960 |
| Israelis | 100.0 /100 | #40 | Exceptional $52,937 |
| Immigrants | Lithuania | 100.0 /100 | #41 | Exceptional $52,769 |
| Maltese | 100.0 /100 | #42 | Exceptional $52,526 |