Guatemalan vs Immigrants from Switzerland In Labor Force | Age 45-54

COMPARE

Guatemalan
Race
Ancestry
AfghanAfricanAlaska NativeAlaskan AthabascanAlbanianAleutAlsatianAmericanApacheArabArapahoArgentineanArmenianAssyrian/Chaldean/SyriacAustralianAustrianBahamianBangladeshiBarbadianBasqueBelgianBelizeanBermudanBhutaneseBlackfeetBolivianBrazilianBritishBritish West IndianBulgarianBurmeseCajunCambodianCanadianCape VerdeanCarpatho RusynCelticCentral AmericanCentral American IndianCherokeeCheyenneChickasawChileanChineseChippewaChoctawColombianColvilleComancheCosta RicanCreeCreekCroatianCrowCubanCypriotCzechCzechoslovakianDanishDelawareDominicanDutchDutch West IndianEastern EuropeanEcuadorianEgyptianEnglishEstonianEthiopianEuropeanFijianFilipinoFinnishFrenchFrench American IndianFrench CanadianGermanGerman RussianGhanaianGreekGuamanian/ChamorroGuatemalanGuyaneseHaitianHmongHonduranHopiHoumaHungarianIcelanderIndian (Asian)IndonesianInupiatIranianIraqiIrishIroquoisIsraeliItalianJamaicanJapaneseJordanianKenyanKiowaKoreanLaotianLatvianLebaneseLiberianLithuanianLumbeeLuxembourgerMacedonianMalaysianMalteseMarshalleseMenomineeMexicanMexican American IndianMongolianMoroccanNative HawaiianNavajoNepaleseNew ZealanderNicaraguanNigerianNorthern EuropeanNorwegianOkinawanOsageOttawaPaiutePakistaniPalestinianPanamanianParaguayanPennsylvania GermanPeruvianPimaPolishPortuguesePotawatomiPuebloPuerto RicanPuget Sound SalishRomanianRussianSalvadoranSamoanScandinavianScotch-IrishScottishSeminoleSenegaleseSerbianShoshoneSierra LeoneanSiouxSlavicSlovakSloveneSomaliSouth AfricanSouth AmericanSouth American IndianSoviet UnionSpaniardSpanishSpanish AmericanSpanish American IndianSri LankanSubsaharan AfricanSudaneseSwedishSwissSyrianTaiwaneseThaiTlingit-HaidaTohono O'OdhamTonganTrinidadian and TobagonianTsimshianTurkishU.S. Virgin IslanderUgandanUkrainianUruguayanUteVenezuelanVietnameseWelshWest IndianYakamaYaquiYugoslavianYumanYup'ikZimbabwean
Immigration
NonimmigrantsImmigrantsAfghanistanAfricaAlbaniaArgentinaArmeniaAsiaAustraliaAustriaBahamasBangladeshBarbadosBelarusBelgiumBelizeBoliviaBosnia and HerzegovinaBrazilBulgariaBurma/MyanmarCabo VerdeCambodiaCameroonCanadaCaribbeanCentral AmericaChileChinaColombiaCongoCosta RicaCroatiaCubaCzechoslovakiaDenmarkDominicaDominican RepublicEastern AfricaEastern AsiaEastern EuropeEcuadorEgyptEl SalvadorEnglandEritreaEthiopiaEuropeFijiFranceGermanyGhanaGreeceGrenadaGuatemalaGuyanaHaitiHondurasHong KongHungaryIndiaIndonesiaIranIraqIrelandIsraelItalyJamaicaJapanJordanKazakhstanKenyaKoreaKuwaitLaosLatin AmericaLatviaLebanonLiberiaLithuaniaMalaysiaMexicoMicronesiaMiddle AfricaMoldovaMoroccoNepalNetherlandsNicaraguaNigeriaNorth AmericaNorth MacedoniaNorthern AfricaNorthern EuropeNorwayOceaniaPakistanPanamaPeruPhilippinesPolandPortugalRomaniaRussiaSaudi ArabiaScotlandSenegalSerbiaSierra LeoneSingaporeSomaliaSouth AfricaSouth AmericaSouth Central AsiaSouth Eastern AsiaSouthern EuropeSpainSri LankaSt. Vincent and the GrenadinesSudanSwedenSyriaTaiwanThailandTrinidad and TobagoTurkeyUgandaUkraineUruguayUzbekistanVenezuelaVietnamWest IndiesWestern AfricaWestern AsiaWestern EuropeYemenZaireZimbabweAzores
Immigrants from Switzerland
Race
Ancestry
AfghanAfricanAlaska NativeAlaskan AthabascanAlbanianAleutAlsatianAmericanApacheArabArapahoArgentineanArmenianAssyrian/Chaldean/SyriacAustralianAustrianBahamianBangladeshiBarbadianBasqueBelgianBelizeanBermudanBhutaneseBlackfeetBolivianBrazilianBritishBritish West IndianBulgarianBurmeseCajunCambodianCanadianCape VerdeanCarpatho RusynCelticCentral AmericanCentral American IndianCherokeeCheyenneChickasawChileanChineseChippewaChoctawColombianColvilleComancheCosta RicanCreeCreekCroatianCrowCubanCypriotCzechCzechoslovakianDanishDelawareDominicanDutchDutch West IndianEastern EuropeanEcuadorianEgyptianEnglishEstonianEthiopianEuropeanFijianFilipinoFinnishFrenchFrench American IndianFrench CanadianGermanGerman RussianGhanaianGreekGuamanian/ChamorroGuyaneseHaitianHmongHonduranHopiHoumaHungarianIcelanderIndian (Asian)IndonesianInupiatIranianIraqiIrishIroquoisIsraeliItalianJamaicanJapaneseJordanianKenyanKiowaKoreanLaotianLatvianLebaneseLiberianLithuanianLumbeeLuxembourgerMacedonianMalaysianMalteseMarshalleseMenomineeMexicanMexican American IndianMongolianMoroccanNative HawaiianNavajoNepaleseNew ZealanderNicaraguanNigerianNorthern EuropeanNorwegianOkinawanOsageOttawaPaiutePakistaniPalestinianPanamanianParaguayanPennsylvania GermanPeruvianPimaPolishPortuguesePotawatomiPuebloPuerto RicanPuget Sound SalishRomanianRussianSalvadoranSamoanScandinavianScotch-IrishScottishSeminoleSenegaleseSerbianShoshoneSierra LeoneanSiouxSlavicSlovakSloveneSomaliSouth AfricanSouth AmericanSouth American IndianSoviet UnionSpaniardSpanishSpanish AmericanSpanish American IndianSri LankanSubsaharan AfricanSudaneseSwedishSwissSyrianTaiwaneseThaiTlingit-HaidaTohono O'OdhamTonganTrinidadian and TobagonianTsimshianTurkishU.S. Virgin IslanderUgandanUkrainianUruguayanUteVenezuelanVietnameseWelshWest IndianYakamaYaquiYugoslavianYumanYup'ikZimbabwean
Immigration
NonimmigrantsImmigrantsAfghanistanAfricaAlbaniaArgentinaArmeniaAsiaAustraliaAustriaBahamasBangladeshBarbadosBelarusBelgiumBelizeBoliviaBosnia and HerzegovinaBrazilBulgariaBurma/MyanmarCabo VerdeCambodiaCameroonCanadaCaribbeanCentral AmericaChileChinaColombiaCongoCosta RicaCroatiaCubaCzechoslovakiaDenmarkDominicaDominican RepublicEastern AfricaEastern AsiaEastern EuropeEcuadorEgyptEl SalvadorEnglandEritreaEthiopiaEuropeFijiFranceGermanyGhanaGreeceGrenadaGuatemalaGuyanaHaitiHondurasHong KongHungaryIndiaIndonesiaIranIraqIrelandIsraelItalyJamaicaJapanJordanKazakhstanKenyaKoreaKuwaitLaosLatin AmericaLatviaLebanonLiberiaLithuaniaMalaysiaMexicoMicronesiaMiddle AfricaMoldovaMoroccoNepalNetherlandsNicaraguaNigeriaNorth AmericaNorth MacedoniaNorthern AfricaNorthern EuropeNorwayOceaniaPakistanPanamaPeruPhilippinesPolandPortugalRomaniaRussiaSaudi ArabiaScotlandSenegalSerbiaSierra LeoneSingaporeSomaliaSouth AfricaSouth AmericaSouth Central AsiaSouth Eastern AsiaSouthern EuropeSpainSri LankaSt. Vincent and the GrenadinesSudanSwedenSwitzerlandSyriaTaiwanThailandTrinidad and TobagoTurkeyUgandaUkraineUruguayUzbekistanVenezuelaVietnamWest IndiesWestern AfricaWestern AsiaWestern EuropeYemenZaireZimbabweAzores
In Labor Force | Age 45-54
Income
Poverty
Unemployment
Labor Participation
Family Structure
Vehicle Availability
Education Level
Disability

In Labor Force | Age 45-54 Comparison

Guatemalans

Immigrants from Switzerland

Tragic
Fair
81.2%
IN LABOR FORCE | AGE 45-54
0.0/ 100
METRIC RATING
277th/ 347
METRIC RANK
82.7%
IN LABOR FORCE | AGE 45-54
39.4/ 100
METRIC RATING
179th/ 347
METRIC RANK

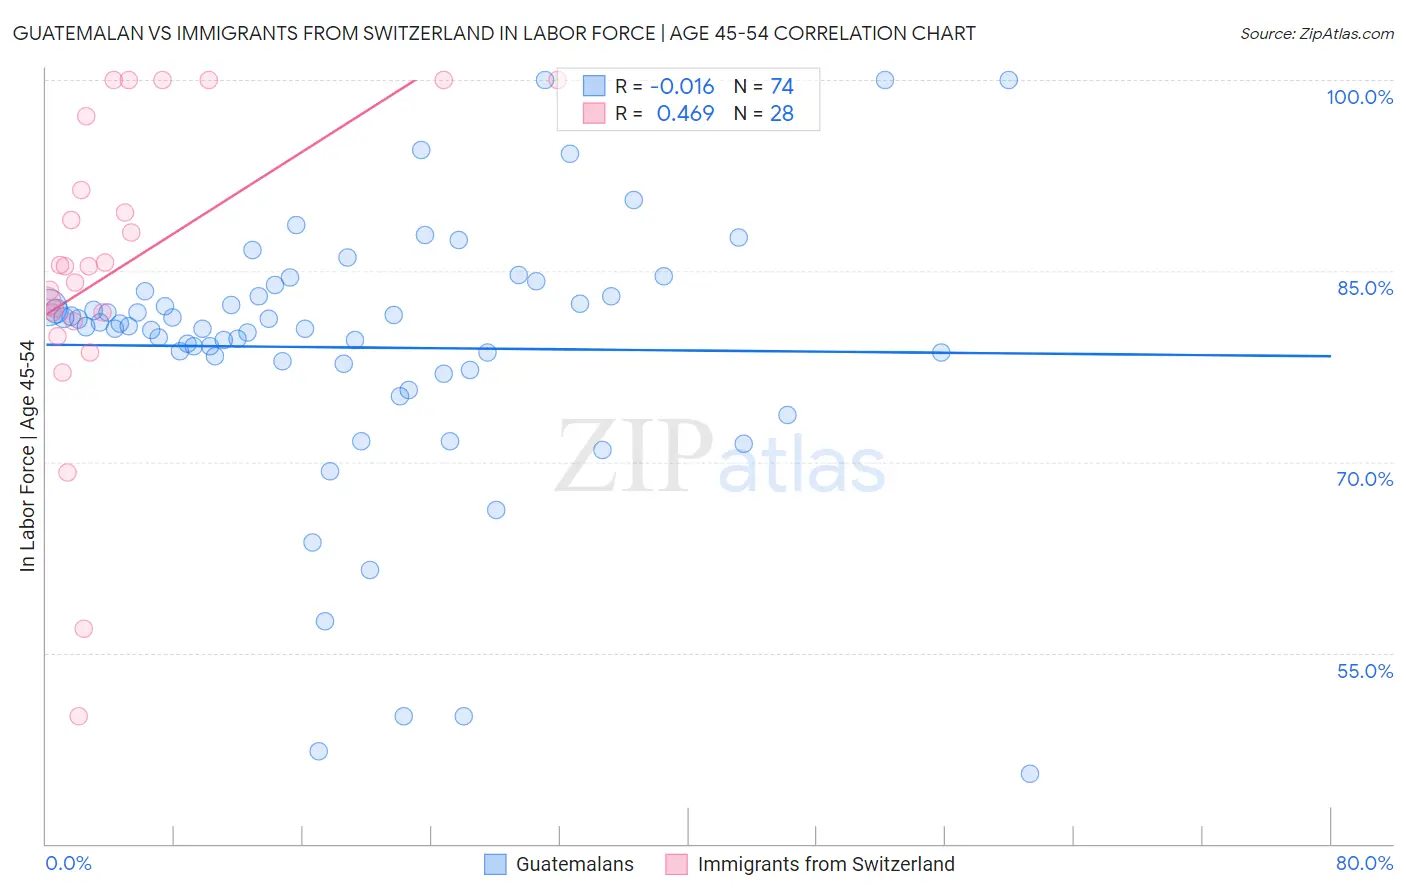
Guatemalan vs Immigrants from Switzerland In Labor Force | Age 45-54 Correlation Chart

The statistical analysis conducted on geographies consisting of 409,275,679 people shows no correlation between the proportion of Guatemalans and labor force participation rate among population between the ages 45 and 54 in the United States with a correlation coefficient (R) of -0.016 and weighted average of 81.2%. Similarly, the statistical analysis conducted on geographies consisting of 148,071,705 people shows a moderate positive correlation between the proportion of Immigrants from Switzerland and labor force participation rate among population between the ages 45 and 54 in the United States with a correlation coefficient (R) of 0.469 and weighted average of 82.7%, a difference of 1.9%.
Guatemalan vs Immigrants from Switzerland In Labor Force | Age 45-54

In Labor Force | Age 45-54 Correlation Summary

MeasurementGuatemalanImmigrants from Switzerland
Minimum45.5%50.0%
Maximum100.0%100.0%
Range54.5%50.0%
Mean79.0%85.2%
Median80.6%85.4%
Interquartile 25% (IQ1)77.7%81.4%
Interquartile 75% (IQ3)83.0%94.3%
Interquartile Range (IQR)5.3%12.9%
Standard Deviation (Sample)10.5%12.2%
Standard Deviation (Population)10.4%12.0%

Similar Demographics by In Labor Force | Age 45-54

Demographics Similar to Guatemalans by In Labor Force | Age 45-54

In terms of in labor force | age 45-54, the demographic groups most similar to Guatemalans are U.S. Virgin Islander (81.2%, a difference of 0.020%), Nonimmigrants (81.2%, a difference of 0.060%), British West Indian (81.2%, a difference of 0.070%), Immigrants from Guatemala (81.1%, a difference of 0.080%), and Immigrants from Micronesia (81.1%, a difference of 0.090%).
DemographicsRating | RankIn Labor Force | Age 45-54
Bangladeshis
0.0
/100
|
#270
Tragic
81.3%
Immigrants | Barbados
0.0
/100
|
#271
Tragic
81.3%
Spanish
0.0
/100
|
#272
Tragic
81.3%
Chippewa
0.0
/100
|
#273
Tragic
81.3%
British West Indians
0.0
/100
|
#274
Tragic
81.2%
Immigrants | Nonimmigrants
0.0
/100
|
#275
Tragic
81.2%
U.S. Virgin Islanders
0.0
/100
|
#276
Tragic
81.2%
Guatemalans
0.0
/100
|
#277
Tragic
81.2%
Immigrants | Guatemala
0.0
/100
|
#278
Tragic
81.1%
Immigrants | Micronesia
0.0
/100
|
#279
Tragic
81.1%
Immigrants | Latin America
0.0
/100
|
#280
Tragic
81.0%
Immigrants | Grenada
0.0
/100
|
#281
Tragic
81.0%
Aleuts
0.0
/100
|
#282
Tragic
81.0%
French American Indians
0.0
/100
|
#283
Tragic
80.8%
Belizeans
0.0
/100
|
#284
Tragic
80.8%

Demographics Similar to Immigrants from Switzerland by In Labor Force | Age 45-54

In terms of in labor force | age 45-54, the demographic groups most similar to Immigrants from Switzerland are Nigerian (82.7%, a difference of 0.010%), Hungarian (82.7%, a difference of 0.010%), Israeli (82.7%, a difference of 0.020%), Immigrants from Hungary (82.7%, a difference of 0.020%), and Immigrants from Nicaragua (82.7%, a difference of 0.050%).
DemographicsRating | RankIn Labor Force | Age 45-54
Icelanders
51.8
/100
|
#172
Average
82.8%
Nicaraguans
50.3
/100
|
#173
Average
82.8%
Costa Ricans
50.0
/100
|
#174
Average
82.8%
Immigrants | Liberia
47.9
/100
|
#175
Average
82.7%
Northern Europeans
46.9
/100
|
#176
Average
82.7%
Immigrants | Nicaragua
44.6
/100
|
#177
Average
82.7%
Nigerians
40.5
/100
|
#178
Average
82.7%
Immigrants | Switzerland
39.4
/100
|
#179
Fair
82.7%
Hungarians
38.0
/100
|
#180
Fair
82.7%
Israelis
37.7
/100
|
#181
Fair
82.7%
Immigrants | Hungary
37.1
/100
|
#182
Fair
82.7%
New Zealanders
32.7
/100
|
#183
Fair
82.6%
Europeans
32.6
/100
|
#184
Fair
82.6%
Immigrants | England
32.2
/100
|
#185
Fair
82.6%
Irish
29.2
/100
|
#186
Fair
82.6%