Chilean vs Immigrants from Switzerland Median Earnings

COMPARE

Chilean
Race
Ancestry
AfghanAfricanAlaska NativeAlaskan AthabascanAlbanianAleutAlsatianAmericanApacheArabArapahoArgentineanArmenianAssyrian/Chaldean/SyriacAustralianAustrianBahamianBangladeshiBarbadianBasqueBelgianBelizeanBermudanBhutaneseBlackfeetBolivianBrazilianBritishBritish West IndianBulgarianBurmeseCajunCambodianCanadianCape VerdeanCarpatho RusynCelticCentral AmericanCentral American IndianCherokeeCheyenneChickasawChileanChineseChippewaChoctawColombianColvilleComancheCosta RicanCreeCreekCroatianCrowCubanCypriotCzechCzechoslovakianDanishDelawareDominicanDutchDutch West IndianEastern EuropeanEcuadorianEgyptianEnglishEstonianEthiopianEuropeanFijianFilipinoFinnishFrenchFrench American IndianFrench CanadianGermanGerman RussianGhanaianGreekGuamanian/ChamorroGuatemalanGuyaneseHaitianHmongHonduranHopiHoumaHungarianIcelanderIndian (Asian)IndonesianInupiatIranianIraqiIrishIroquoisIsraeliItalianJamaicanJapaneseJordanianKenyanKiowaKoreanLaotianLatvianLebaneseLiberianLithuanianLumbeeLuxembourgerMacedonianMalaysianMalteseMarshalleseMenomineeMexicanMexican American IndianMongolianMoroccanNative HawaiianNavajoNepaleseNew ZealanderNicaraguanNigerianNorthern EuropeanNorwegianOkinawanOsageOttawaPaiutePakistaniPalestinianPanamanianParaguayanPennsylvania GermanPeruvianPimaPolishPortuguesePotawatomiPuebloPuerto RicanPuget Sound SalishRomanianRussianSalvadoranSamoanScandinavianScotch-IrishScottishSeminoleSenegaleseSerbianShoshoneSierra LeoneanSiouxSlavicSlovakSloveneSomaliSouth AfricanSouth AmericanSouth American IndianSoviet UnionSpaniardSpanishSpanish AmericanSpanish American IndianSri LankanSubsaharan AfricanSudaneseSwedishSwissSyrianTaiwaneseThaiTlingit-HaidaTohono O'OdhamTonganTrinidadian and TobagonianTsimshianTurkishU.S. Virgin IslanderUgandanUkrainianUruguayanUteVenezuelanVietnameseWelshWest IndianYakamaYaquiYugoslavianYumanYup'ikZimbabwean
Immigration
NonimmigrantsImmigrantsAfghanistanAfricaAlbaniaArgentinaArmeniaAsiaAustraliaAustriaBahamasBangladeshBarbadosBelarusBelgiumBelizeBoliviaBosnia and HerzegovinaBrazilBulgariaBurma/MyanmarCabo VerdeCambodiaCameroonCanadaCaribbeanCentral AmericaChileChinaColombiaCongoCosta RicaCroatiaCubaCzechoslovakiaDenmarkDominicaDominican RepublicEastern AfricaEastern AsiaEastern EuropeEcuadorEgyptEl SalvadorEnglandEritreaEthiopiaEuropeFijiFranceGermanyGhanaGreeceGrenadaGuatemalaGuyanaHaitiHondurasHong KongHungaryIndiaIndonesiaIranIraqIrelandIsraelItalyJamaicaJapanJordanKazakhstanKenyaKoreaKuwaitLaosLatin AmericaLatviaLebanonLiberiaLithuaniaMalaysiaMexicoMicronesiaMiddle AfricaMoldovaMoroccoNepalNetherlandsNicaraguaNigeriaNorth AmericaNorth MacedoniaNorthern AfricaNorthern EuropeNorwayOceaniaPakistanPanamaPeruPhilippinesPolandPortugalRomaniaRussiaSaudi ArabiaScotlandSenegalSerbiaSierra LeoneSingaporeSomaliaSouth AfricaSouth AmericaSouth Central AsiaSouth Eastern AsiaSouthern EuropeSpainSri LankaSt. Vincent and the GrenadinesSudanSwedenSyriaTaiwanThailandTrinidad and TobagoTurkeyUgandaUkraineUruguayUzbekistanVenezuelaVietnamWest IndiesWestern AfricaWestern AsiaWestern EuropeYemenZaireZimbabweAzores
Immigrants from Switzerland
Race
Ancestry
AfghanAfricanAlaska NativeAlaskan AthabascanAlbanianAleutAlsatianAmericanApacheArabArapahoArgentineanArmenianAssyrian/Chaldean/SyriacAustralianAustrianBahamianBangladeshiBarbadianBasqueBelgianBelizeanBermudanBhutaneseBlackfeetBolivianBrazilianBritishBritish West IndianBulgarianBurmeseCajunCambodianCanadianCape VerdeanCarpatho RusynCelticCentral AmericanCentral American IndianCherokeeCheyenneChickasawChineseChippewaChoctawColombianColvilleComancheCosta RicanCreeCreekCroatianCrowCubanCypriotCzechCzechoslovakianDanishDelawareDominicanDutchDutch West IndianEastern EuropeanEcuadorianEgyptianEnglishEstonianEthiopianEuropeanFijianFilipinoFinnishFrenchFrench American IndianFrench CanadianGermanGerman RussianGhanaianGreekGuamanian/ChamorroGuatemalanGuyaneseHaitianHmongHonduranHopiHoumaHungarianIcelanderIndian (Asian)IndonesianInupiatIranianIraqiIrishIroquoisIsraeliItalianJamaicanJapaneseJordanianKenyanKiowaKoreanLaotianLatvianLebaneseLiberianLithuanianLumbeeLuxembourgerMacedonianMalaysianMalteseMarshalleseMenomineeMexicanMexican American IndianMongolianMoroccanNative HawaiianNavajoNepaleseNew ZealanderNicaraguanNigerianNorthern EuropeanNorwegianOkinawanOsageOttawaPaiutePakistaniPalestinianPanamanianParaguayanPennsylvania GermanPeruvianPimaPolishPortuguesePotawatomiPuebloPuerto RicanPuget Sound SalishRomanianRussianSalvadoranSamoanScandinavianScotch-IrishScottishSeminoleSenegaleseSerbianShoshoneSierra LeoneanSiouxSlavicSlovakSloveneSomaliSouth AfricanSouth AmericanSouth American IndianSoviet UnionSpaniardSpanishSpanish AmericanSpanish American IndianSri LankanSubsaharan AfricanSudaneseSwedishSwissSyrianTaiwaneseThaiTlingit-HaidaTohono O'OdhamTonganTrinidadian and TobagonianTsimshianTurkishU.S. Virgin IslanderUgandanUkrainianUruguayanUteVenezuelanVietnameseWelshWest IndianYakamaYaquiYugoslavianYumanYup'ikZimbabwean
Immigration
NonimmigrantsImmigrantsAfghanistanAfricaAlbaniaArgentinaArmeniaAsiaAustraliaAustriaBahamasBangladeshBarbadosBelarusBelgiumBelizeBoliviaBosnia and HerzegovinaBrazilBulgariaBurma/MyanmarCabo VerdeCambodiaCameroonCanadaCaribbeanCentral AmericaChileChinaColombiaCongoCosta RicaCroatiaCubaCzechoslovakiaDenmarkDominicaDominican RepublicEastern AfricaEastern AsiaEastern EuropeEcuadorEgyptEl SalvadorEnglandEritreaEthiopiaEuropeFijiFranceGermanyGhanaGreeceGrenadaGuatemalaGuyanaHaitiHondurasHong KongHungaryIndiaIndonesiaIranIraqIrelandIsraelItalyJamaicaJapanJordanKazakhstanKenyaKoreaKuwaitLaosLatin AmericaLatviaLebanonLiberiaLithuaniaMalaysiaMexicoMicronesiaMiddle AfricaMoldovaMoroccoNepalNetherlandsNicaraguaNigeriaNorth AmericaNorth MacedoniaNorthern AfricaNorthern EuropeNorwayOceaniaPakistanPanamaPeruPhilippinesPolandPortugalRomaniaRussiaSaudi ArabiaScotlandSenegalSerbiaSierra LeoneSingaporeSomaliaSouth AfricaSouth AmericaSouth Central AsiaSouth Eastern AsiaSouthern EuropeSpainSri LankaSt. Vincent and the GrenadinesSudanSwedenSwitzerlandSyriaTaiwanThailandTrinidad and TobagoTurkeyUgandaUkraineUruguayUzbekistanVenezuelaVietnamWest IndiesWestern AfricaWestern AsiaWestern EuropeYemenZaireZimbabweAzores
Median Earnings
Income
Poverty
Unemployment
Labor Participation
Family Structure
Vehicle Availability
Education Level
Disability

Median Earnings Comparison

Chileans

Immigrants from Switzerland

Exceptional
Exceptional
$48,504
MEDIAN EARNINGS
94.8/ 100
METRIC RATING
122nd/ 347
METRIC RANK
$53,211
MEDIAN EARNINGS
100.0/ 100
METRIC RATING
35th/ 347
METRIC RANK

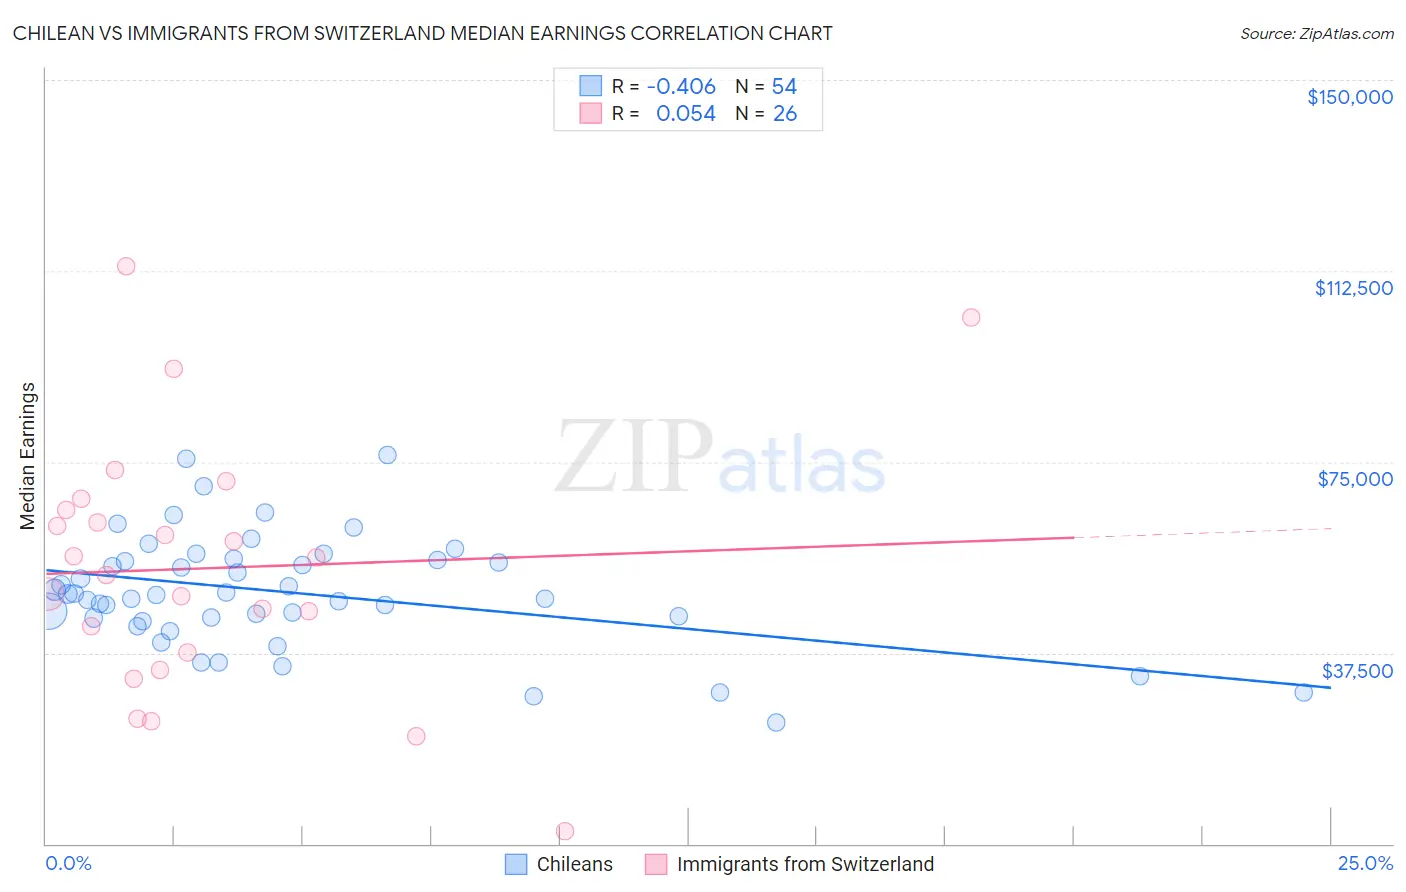
Chilean vs Immigrants from Switzerland Median Earnings Correlation Chart

The statistical analysis conducted on geographies consisting of 256,682,531 people shows a moderate negative correlation between the proportion of Chileans and median earnings in the United States with a correlation coefficient (R) of -0.406 and weighted average of $48,504. Similarly, the statistical analysis conducted on geographies consisting of 148,076,857 people shows a slight positive correlation between the proportion of Immigrants from Switzerland and median earnings in the United States with a correlation coefficient (R) of 0.054 and weighted average of $53,211, a difference of 9.7%.
Chilean vs Immigrants from Switzerland Median Earnings

Median Earnings Correlation Summary

MeasurementChileanImmigrants from Switzerland
Minimum$23,911$2,499
Maximum$76,406$113,419
Range$52,495$110,920
Mean$49,382$54,118
Median$48,999$54,480
Interquartile 25% (IQ1)$44,321$37,656
Interquartile 75% (IQ3)$55,791$65,606
Interquartile Range (IQR)$11,470$27,950
Standard Deviation (Sample)$11,094$25,059
Standard Deviation (Population)$10,991$24,573

Similar Demographics by Median Earnings

Demographics Similar to Chileans by Median Earnings

In terms of median earnings, the demographic groups most similar to Chileans are Arab ($48,599, a difference of 0.19%), Carpatho Rusyn ($48,617, a difference of 0.23%), Immigrants from Syria ($48,375, a difference of 0.27%), Brazilian ($48,356, a difference of 0.31%), and Polish ($48,659, a difference of 0.32%).
DemographicsRating | RankMedian Earnings
Chinese
96.7
/100
|
#115
Exceptional
$48,836
Koreans
96.2
/100
|
#116
Exceptional
$48,727
Serbians
95.9
/100
|
#117
Exceptional
$48,677
Immigrants | Jordan
95.9
/100
|
#118
Exceptional
$48,673
Poles
95.8
/100
|
#119
Exceptional
$48,659
Carpatho Rusyns
95.5
/100
|
#120
Exceptional
$48,617
Arabs
95.4
/100
|
#121
Exceptional
$48,599
Chileans
94.8
/100
|
#122
Exceptional
$48,504
Immigrants | Syria
93.9
/100
|
#123
Exceptional
$48,375
Brazilians
93.7
/100
|
#124
Exceptional
$48,356
Immigrants | Fiji
93.3
/100
|
#125
Exceptional
$48,305
Assyrians/Chaldeans/Syriacs
93.3
/100
|
#126
Exceptional
$48,304
Sierra Leoneans
93.1
/100
|
#127
Exceptional
$48,286
Immigrants | Philippines
92.9
/100
|
#128
Exceptional
$48,266
Pakistanis
92.8
/100
|
#129
Exceptional
$48,254

Demographics Similar to Immigrants from Switzerland by Median Earnings

In terms of median earnings, the demographic groups most similar to Immigrants from Switzerland are Immigrants from Denmark ($53,186, a difference of 0.050%), Immigrants from Sri Lanka ($53,268, a difference of 0.11%), Immigrants from Greece ($53,282, a difference of 0.13%), Immigrants from Asia ($53,310, a difference of 0.19%), and Russian ($53,334, a difference of 0.23%).
DemographicsRating | RankMedian Earnings
Immigrants | France
100.0
/100
|
#28
Exceptional
$53,490
Immigrants | Russia
100.0
/100
|
#29
Exceptional
$53,457
Cambodians
100.0
/100
|
#30
Exceptional
$53,386
Russians
100.0
/100
|
#31
Exceptional
$53,334
Immigrants | Asia
100.0
/100
|
#32
Exceptional
$53,310
Immigrants | Greece
100.0
/100
|
#33
Exceptional
$53,282
Immigrants | Sri Lanka
100.0
/100
|
#34
Exceptional
$53,268
Immigrants | Switzerland
100.0
/100
|
#35
Exceptional
$53,211
Immigrants | Denmark
100.0
/100
|
#36
Exceptional
$53,186
Immigrants | Belarus
100.0
/100
|
#37
Exceptional
$53,043
Latvians
100.0
/100
|
#38
Exceptional
$53,001
Immigrants | Turkey
100.0
/100
|
#39
Exceptional
$52,960
Israelis
100.0
/100
|
#40
Exceptional
$52,937
Immigrants | Lithuania
100.0
/100
|
#41
Exceptional
$52,769
Maltese
100.0
/100
|
#42
Exceptional
$52,526