Immigrants from Lithuania vs Dutch West Indian Per Capita Income
COMPARE
Immigrants from Lithuania
Dutch West Indian
Per Capita Income
Per Capita Income Comparison
Immigrants from Lithuania
Dutch West Indians
$51,361
PER CAPITA INCOME
100.0/ 100
METRIC RATING
43rd/ 347
METRIC RANK
$35,922
PER CAPITA INCOME
0.0/ 100
METRIC RATING
317th/ 347
METRIC RANK
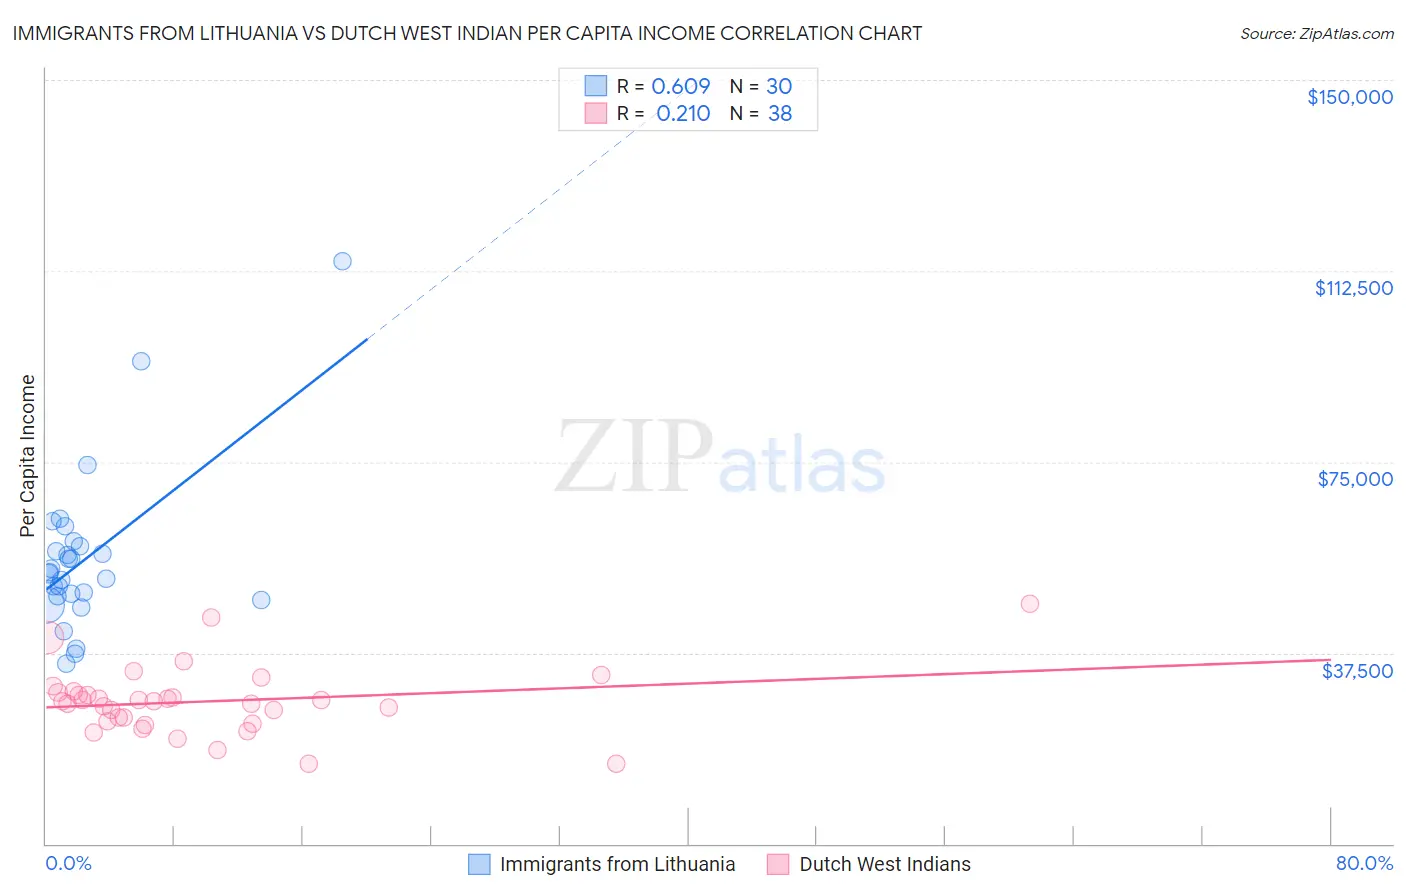
Immigrants from Lithuania vs Dutch West Indian Per Capita Income Correlation Chart
The statistical analysis conducted on geographies consisting of 117,724,932 people shows a significant positive correlation between the proportion of Immigrants from Lithuania and per capita income in the United States with a correlation coefficient (R) of 0.609 and weighted average of $51,361. Similarly, the statistical analysis conducted on geographies consisting of 85,776,103 people shows a weak positive correlation between the proportion of Dutch West Indians and per capita income in the United States with a correlation coefficient (R) of 0.210 and weighted average of $35,922, a difference of 43.0%.
Per Capita Income Correlation Summary
| Measurement | Immigrants from Lithuania | Dutch West Indian |
| Minimum | $35,413 | $15,696 |
| Maximum | $114,327 | $47,132 |
| Range | $78,914 | $31,436 |
| Mean | $56,005 | $27,952 |
| Median | $53,196 | $27,901 |
| Interquartile 25% (IQ1) | $48,580 | $24,038 |
| Interquartile 75% (IQ3) | $58,433 | $29,729 |
| Interquartile Range (IQR) | $9,853 | $5,691 |
| Standard Deviation (Sample) | $15,760 | $6,566 |
| Standard Deviation (Population) | $15,495 | $6,479 |
Similar Demographics by Per Capita Income
Demographics Similar to Immigrants from Lithuania by Per Capita Income
In terms of per capita income, the demographic groups most similar to Immigrants from Lithuania are Immigrants from Turkey ($51,368, a difference of 0.010%), Immigrants from South Africa ($51,465, a difference of 0.20%), Immigrants from Korea ($51,671, a difference of 0.60%), Cambodian ($51,731, a difference of 0.72%), and Immigrants from Czechoslovakia ($51,770, a difference of 0.80%).
| Demographics | Rating | Rank | Per Capita Income |
| Immigrants | Greece | 100.0 /100 | #36 | Exceptional $51,891 |
| Estonians | 100.0 /100 | #37 | Exceptional $51,875 |
| Immigrants | Czechoslovakia | 100.0 /100 | #38 | Exceptional $51,770 |
| Cambodians | 100.0 /100 | #39 | Exceptional $51,731 |
| Immigrants | Korea | 100.0 /100 | #40 | Exceptional $51,671 |
| Immigrants | South Africa | 100.0 /100 | #41 | Exceptional $51,465 |
| Immigrants | Turkey | 100.0 /100 | #42 | Exceptional $51,368 |
| Immigrants | Lithuania | 100.0 /100 | #43 | Exceptional $51,361 |
| Immigrants | Europe | 100.0 /100 | #44 | Exceptional $50,950 |
| Immigrants | Spain | 100.0 /100 | #45 | Exceptional $50,933 |
| Immigrants | Latvia | 100.0 /100 | #46 | Exceptional $50,914 |
| Bulgarians | 100.0 /100 | #47 | Exceptional $50,906 |
| Immigrants | Serbia | 100.0 /100 | #48 | Exceptional $50,810 |
| New Zealanders | 100.0 /100 | #49 | Exceptional $50,575 |
| Immigrants | Sri Lanka | 100.0 /100 | #50 | Exceptional $50,555 |
Demographics Similar to Dutch West Indians by Per Capita Income
In terms of per capita income, the demographic groups most similar to Dutch West Indians are Bangladeshi ($35,897, a difference of 0.070%), Choctaw ($35,999, a difference of 0.21%), Yaqui ($36,112, a difference of 0.53%), Immigrants from Congo ($35,720, a difference of 0.57%), and Hispanic or Latino ($35,688, a difference of 0.66%).
| Demographics | Rating | Rank | Per Capita Income |
| Ute | 0.0 /100 | #310 | Tragic $36,651 |
| Chippewa | 0.0 /100 | #311 | Tragic $36,631 |
| Chickasaw | 0.0 /100 | #312 | Tragic $36,475 |
| Bahamians | 0.0 /100 | #313 | Tragic $36,427 |
| Seminole | 0.0 /100 | #314 | Tragic $36,180 |
| Yaqui | 0.0 /100 | #315 | Tragic $36,112 |
| Choctaw | 0.0 /100 | #316 | Tragic $35,999 |
| Dutch West Indians | 0.0 /100 | #317 | Tragic $35,922 |
| Bangladeshis | 0.0 /100 | #318 | Tragic $35,897 |
| Immigrants | Congo | 0.0 /100 | #319 | Tragic $35,720 |
| Hispanics or Latinos | 0.0 /100 | #320 | Tragic $35,688 |
| Blacks/African Americans | 0.0 /100 | #321 | Tragic $35,564 |
| Creek | 0.0 /100 | #322 | Tragic $35,546 |
| Cheyenne | 0.0 /100 | #323 | Tragic $35,276 |
| Kiowa | 0.0 /100 | #324 | Tragic $35,102 |