Canadian vs Dutch West Indian Per Capita Income
COMPARE
Canadian
Dutch West Indian
Per Capita Income
Per Capita Income Comparison
Canadians
Dutch West Indians
$45,858
PER CAPITA INCOME
92.2/ 100
METRIC RATING
121st/ 347
METRIC RANK
$35,922
PER CAPITA INCOME
0.0/ 100
METRIC RATING
317th/ 347
METRIC RANK
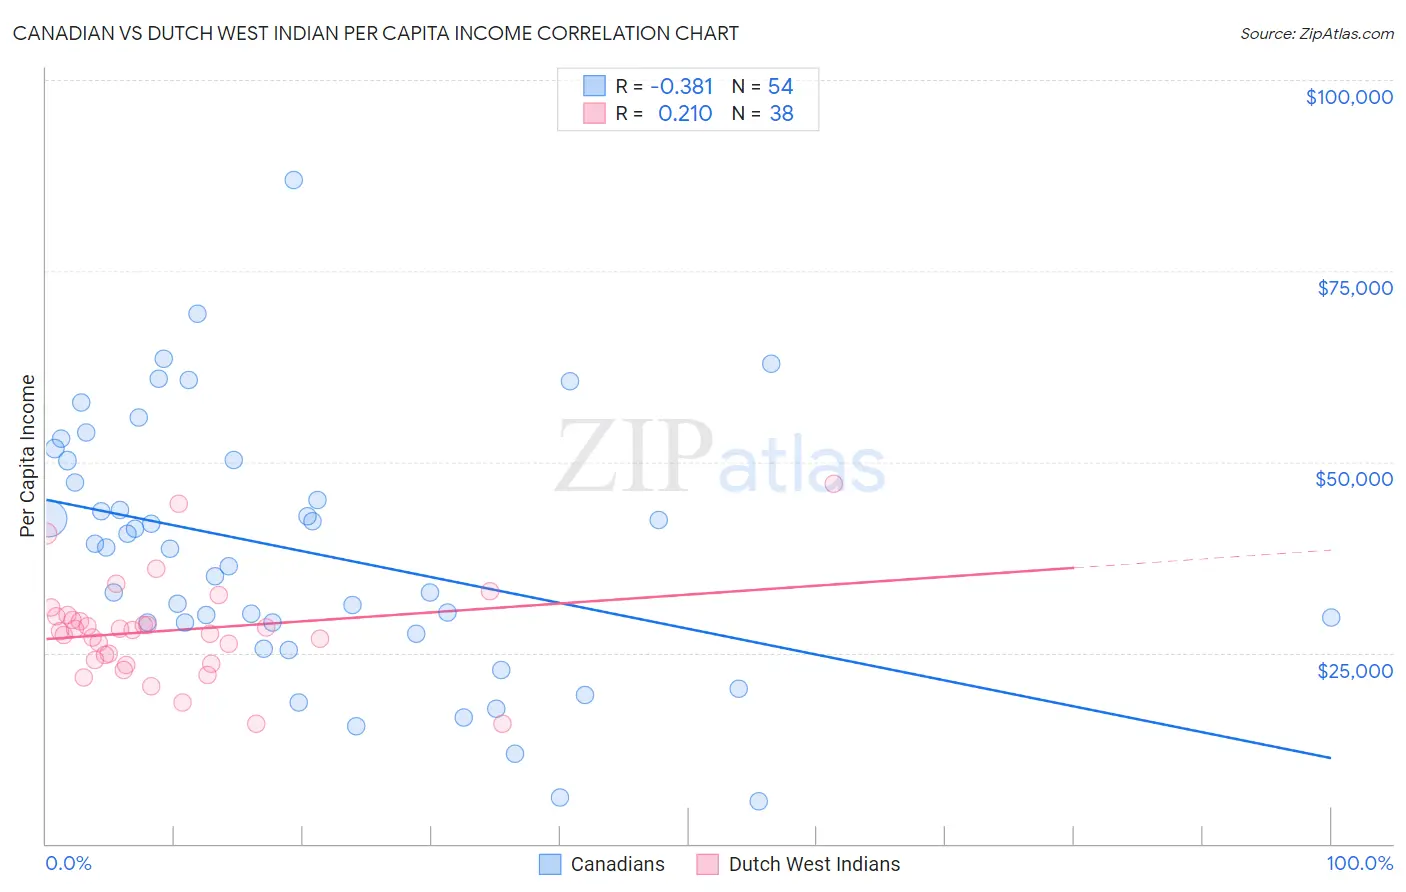
Canadian vs Dutch West Indian Per Capita Income Correlation Chart
The statistical analysis conducted on geographies consisting of 437,574,482 people shows a mild negative correlation between the proportion of Canadians and per capita income in the United States with a correlation coefficient (R) of -0.381 and weighted average of $45,858. Similarly, the statistical analysis conducted on geographies consisting of 85,776,103 people shows a weak positive correlation between the proportion of Dutch West Indians and per capita income in the United States with a correlation coefficient (R) of 0.210 and weighted average of $35,922, a difference of 27.7%.
Per Capita Income Correlation Summary
| Measurement | Canadian | Dutch West Indian |
| Minimum | $5,500 | $15,696 |
| Maximum | $86,868 | $47,132 |
| Range | $81,368 | $31,436 |
| Mean | $38,269 | $27,952 |
| Median | $38,676 | $27,901 |
| Interquartile 25% (IQ1) | $28,934 | $24,038 |
| Interquartile 75% (IQ3) | $50,164 | $29,729 |
| Interquartile Range (IQR) | $21,231 | $5,691 |
| Standard Deviation (Sample) | $16,643 | $6,566 |
| Standard Deviation (Population) | $16,488 | $6,479 |
Similar Demographics by Per Capita Income
Demographics Similar to Canadians by Per Capita Income
In terms of per capita income, the demographic groups most similar to Canadians are Moroccan ($45,854, a difference of 0.010%), Lebanese ($45,840, a difference of 0.040%), European ($45,836, a difference of 0.050%), Zimbabwean ($45,804, a difference of 0.12%), and Immigrants from Ethiopia ($45,923, a difference of 0.14%).
| Demographics | Rating | Rank | Per Capita Income |
| Afghans | 94.9 /100 | #114 | Exceptional $46,268 |
| Immigrants | Chile | 94.6 /100 | #115 | Exceptional $46,213 |
| Poles | 94.1 /100 | #116 | Exceptional $46,123 |
| Chinese | 93.9 /100 | #117 | Exceptional $46,098 |
| Immigrants | Saudi Arabia | 93.3 /100 | #118 | Exceptional $46,008 |
| Immigrants | Poland | 93.1 /100 | #119 | Exceptional $45,979 |
| Immigrants | Ethiopia | 92.7 /100 | #120 | Exceptional $45,923 |
| Canadians | 92.2 /100 | #121 | Exceptional $45,858 |
| Moroccans | 92.1 /100 | #122 | Exceptional $45,854 |
| Lebanese | 92.0 /100 | #123 | Exceptional $45,840 |
| Europeans | 92.0 /100 | #124 | Exceptional $45,836 |
| Zimbabweans | 91.7 /100 | #125 | Exceptional $45,804 |
| Palestinians | 91.6 /100 | #126 | Exceptional $45,790 |
| Immigrants | Germany | 91.3 /100 | #127 | Exceptional $45,751 |
| Swedes | 91.3 /100 | #128 | Exceptional $45,750 |
Demographics Similar to Dutch West Indians by Per Capita Income
In terms of per capita income, the demographic groups most similar to Dutch West Indians are Bangladeshi ($35,897, a difference of 0.070%), Choctaw ($35,999, a difference of 0.21%), Yaqui ($36,112, a difference of 0.53%), Immigrants from Congo ($35,720, a difference of 0.57%), and Hispanic or Latino ($35,688, a difference of 0.66%).
| Demographics | Rating | Rank | Per Capita Income |
| Ute | 0.0 /100 | #310 | Tragic $36,651 |
| Chippewa | 0.0 /100 | #311 | Tragic $36,631 |
| Chickasaw | 0.0 /100 | #312 | Tragic $36,475 |
| Bahamians | 0.0 /100 | #313 | Tragic $36,427 |
| Seminole | 0.0 /100 | #314 | Tragic $36,180 |
| Yaqui | 0.0 /100 | #315 | Tragic $36,112 |
| Choctaw | 0.0 /100 | #316 | Tragic $35,999 |
| Dutch West Indians | 0.0 /100 | #317 | Tragic $35,922 |
| Bangladeshis | 0.0 /100 | #318 | Tragic $35,897 |
| Immigrants | Congo | 0.0 /100 | #319 | Tragic $35,720 |
| Hispanics or Latinos | 0.0 /100 | #320 | Tragic $35,688 |
| Blacks/African Americans | 0.0 /100 | #321 | Tragic $35,564 |
| Creek | 0.0 /100 | #322 | Tragic $35,546 |
| Cheyenne | 0.0 /100 | #323 | Tragic $35,276 |
| Kiowa | 0.0 /100 | #324 | Tragic $35,102 |