Fijian vs Dutch West Indian Per Capita Income
COMPARE
Fijian
Dutch West Indian
Per Capita Income
Per Capita Income Comparison
Fijians
Dutch West Indians
$36,690
PER CAPITA INCOME
0.0/ 100
METRIC RATING
308th/ 347
METRIC RANK
$35,922
PER CAPITA INCOME
0.0/ 100
METRIC RATING
317th/ 347
METRIC RANK
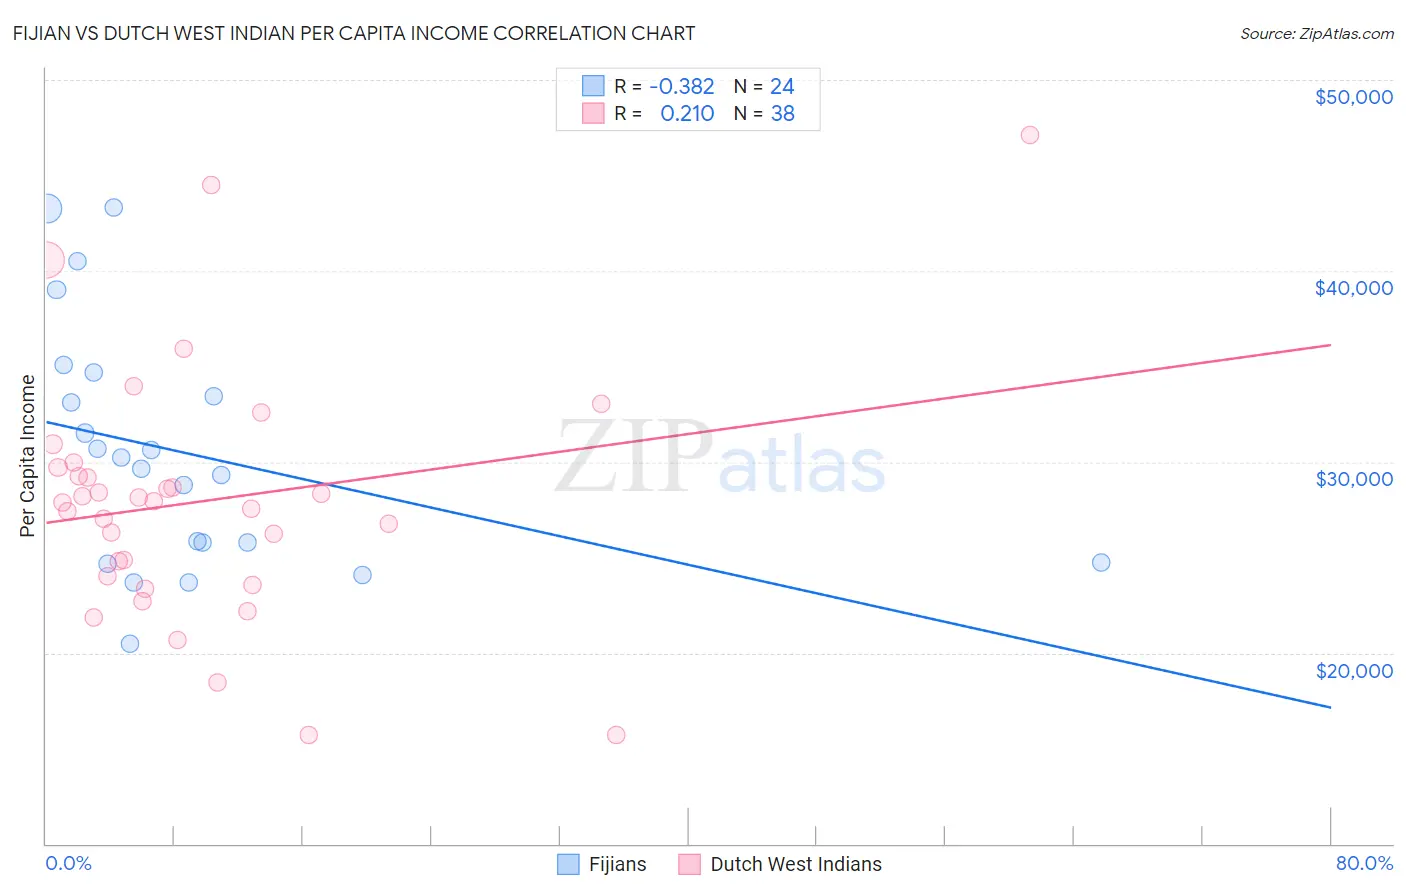
Fijian vs Dutch West Indian Per Capita Income Correlation Chart
The statistical analysis conducted on geographies consisting of 55,948,768 people shows a mild negative correlation between the proportion of Fijians and per capita income in the United States with a correlation coefficient (R) of -0.382 and weighted average of $36,690. Similarly, the statistical analysis conducted on geographies consisting of 85,776,103 people shows a weak positive correlation between the proportion of Dutch West Indians and per capita income in the United States with a correlation coefficient (R) of 0.210 and weighted average of $35,922, a difference of 2.1%.
Per Capita Income Correlation Summary
| Measurement | Fijian | Dutch West Indian |
| Minimum | $20,445 | $15,696 |
| Maximum | $43,340 | $47,132 |
| Range | $22,895 | $31,436 |
| Mean | $30,488 | $27,952 |
| Median | $29,934 | $27,901 |
| Interquartile 25% (IQ1) | $25,226 | $24,038 |
| Interquartile 75% (IQ3) | $34,063 | $29,729 |
| Interquartile Range (IQR) | $8,837 | $5,691 |
| Standard Deviation (Sample) | $6,360 | $6,566 |
| Standard Deviation (Population) | $6,227 | $6,479 |
Demographics Similar to Fijians and Dutch West Indians by Per Capita Income
In terms of per capita income, the demographic groups most similar to Fijians are Immigrants from Honduras ($36,665, a difference of 0.070%), Ute ($36,651, a difference of 0.10%), Chippewa ($36,631, a difference of 0.16%), Immigrants from Latin America ($36,823, a difference of 0.36%), and Immigrants from Haiti ($36,849, a difference of 0.43%). Similarly, the demographic groups most similar to Dutch West Indians are Bangladeshi ($35,897, a difference of 0.070%), Choctaw ($35,999, a difference of 0.21%), Yaqui ($36,112, a difference of 0.53%), Immigrants from Congo ($35,720, a difference of 0.57%), and Hispanic or Latino ($35,688, a difference of 0.66%).
| Demographics | Rating | Rank | Per Capita Income |
| Shoshone | 0.1 /100 | #302 | Tragic $37,072 |
| Paiute | 0.1 /100 | #303 | Tragic $37,066 |
| Hondurans | 0.1 /100 | #304 | Tragic $37,031 |
| Inupiat | 0.1 /100 | #305 | Tragic $36,999 |
| Immigrants | Haiti | 0.0 /100 | #306 | Tragic $36,849 |
| Immigrants | Latin America | 0.0 /100 | #307 | Tragic $36,823 |
| Fijians | 0.0 /100 | #308 | Tragic $36,690 |
| Immigrants | Honduras | 0.0 /100 | #309 | Tragic $36,665 |
| Ute | 0.0 /100 | #310 | Tragic $36,651 |
| Chippewa | 0.0 /100 | #311 | Tragic $36,631 |
| Chickasaw | 0.0 /100 | #312 | Tragic $36,475 |
| Bahamians | 0.0 /100 | #313 | Tragic $36,427 |
| Seminole | 0.0 /100 | #314 | Tragic $36,180 |
| Yaqui | 0.0 /100 | #315 | Tragic $36,112 |
| Choctaw | 0.0 /100 | #316 | Tragic $35,999 |
| Dutch West Indians | 0.0 /100 | #317 | Tragic $35,922 |
| Bangladeshis | 0.0 /100 | #318 | Tragic $35,897 |
| Immigrants | Congo | 0.0 /100 | #319 | Tragic $35,720 |
| Hispanics or Latinos | 0.0 /100 | #320 | Tragic $35,688 |
| Blacks/African Americans | 0.0 /100 | #321 | Tragic $35,564 |
| Creek | 0.0 /100 | #322 | Tragic $35,546 |