Guatemalan vs Australian 4th Grade
COMPARE
Guatemalan
Australian
4th Grade
4th Grade Comparison
Guatemalans
Australians
95.3%
4TH GRADE
0.0/ 100
METRIC RATING
339th/ 347
METRIC RANK
98.1%
4TH GRADE
99.8/ 100
METRIC RATING
52nd/ 347
METRIC RANK
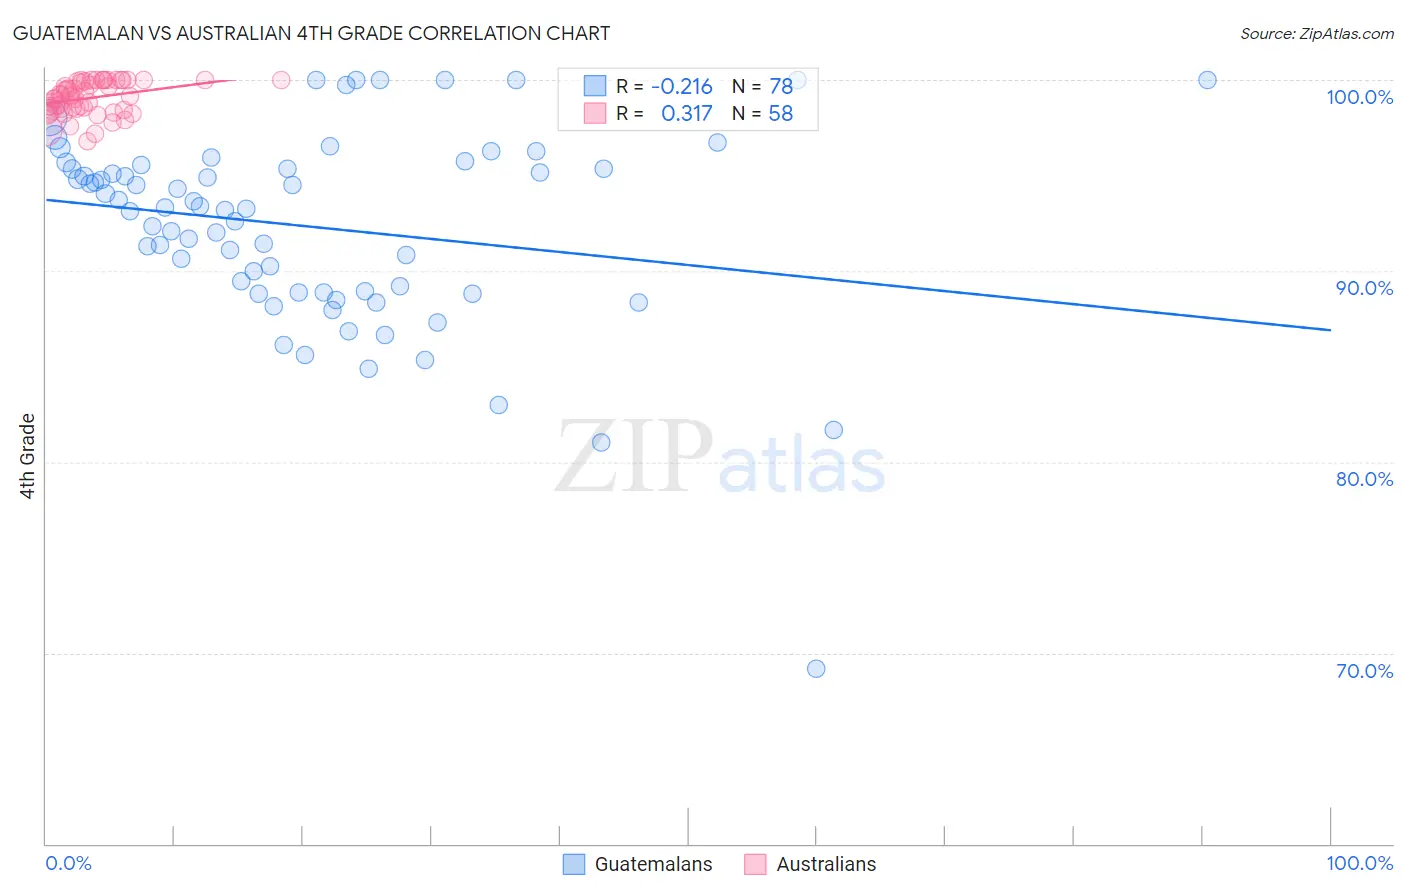
Guatemalan vs Australian 4th Grade Correlation Chart
The statistical analysis conducted on geographies consisting of 409,566,469 people shows a weak negative correlation between the proportion of Guatemalans and percentage of population with at least 4th grade education in the United States with a correlation coefficient (R) of -0.216 and weighted average of 95.3%. Similarly, the statistical analysis conducted on geographies consisting of 224,153,392 people shows a mild positive correlation between the proportion of Australians and percentage of population with at least 4th grade education in the United States with a correlation coefficient (R) of 0.317 and weighted average of 98.1%, a difference of 2.9%.
4th Grade Correlation Summary
| Measurement | Guatemalan | Australian |
| Minimum | 69.2% | 96.8% |
| Maximum | 100.0% | 100.0% |
| Range | 30.8% | 3.2% |
| Mean | 92.3% | 99.1% |
| Median | 93.3% | 99.2% |
| Interquartile 25% (IQ1) | 88.8% | 98.5% |
| Interquartile 75% (IQ3) | 95.4% | 99.9% |
| Interquartile Range (IQR) | 6.5% | 1.5% |
| Standard Deviation (Sample) | 5.2% | 0.84% |
| Standard Deviation (Population) | 5.2% | 0.83% |
Similar Demographics by 4th Grade
Demographics Similar to Guatemalans by 4th Grade
In terms of 4th grade, the demographic groups most similar to Guatemalans are Yakama (95.2%, a difference of 0.090%), Immigrants from Yemen (95.2%, a difference of 0.11%), Immigrants from Central America (95.1%, a difference of 0.19%), Central American (95.5%, a difference of 0.20%), and Nepalese (95.5%, a difference of 0.20%).
| Demographics | Rating | Rank | 4th Grade |
| Immigrants | Honduras | 0.0 /100 | #332 | Tragic 95.8% |
| Immigrants | Dominican Republic | 0.0 /100 | #333 | Tragic 95.7% |
| Immigrants | Cabo Verde | 0.0 /100 | #334 | Tragic 95.7% |
| Immigrants | Latin America | 0.0 /100 | #335 | Tragic 95.7% |
| Mexicans | 0.0 /100 | #336 | Tragic 95.6% |
| Central Americans | 0.0 /100 | #337 | Tragic 95.5% |
| Nepalese | 0.0 /100 | #338 | Tragic 95.5% |
| Guatemalans | 0.0 /100 | #339 | Tragic 95.3% |
| Yakama | 0.0 /100 | #340 | Tragic 95.2% |
| Immigrants | Yemen | 0.0 /100 | #341 | Tragic 95.2% |
| Immigrants | Central America | 0.0 /100 | #342 | Tragic 95.1% |
| Immigrants | Guatemala | 0.0 /100 | #343 | Tragic 95.1% |
| Immigrants | Mexico | 0.0 /100 | #344 | Tragic 95.1% |
| Salvadorans | 0.0 /100 | #345 | Tragic 95.0% |
| Immigrants | El Salvador | 0.0 /100 | #346 | Tragic 94.8% |
Demographics Similar to Australians by 4th Grade
In terms of 4th grade, the demographic groups most similar to Australians are Celtic (98.1%, a difference of 0.0%), Slavic (98.1%, a difference of 0.0%), Bulgarian (98.1%, a difference of 0.010%), Immigrants from Scotland (98.1%, a difference of 0.010%), and Maltese (98.1%, a difference of 0.010%).
| Demographics | Rating | Rank | 4th Grade |
| Czechoslovakians | 99.9 /100 | #45 | Exceptional 98.1% |
| Ottawa | 99.9 /100 | #46 | Exceptional 98.1% |
| Arapaho | 99.9 /100 | #47 | Exceptional 98.1% |
| Estonians | 99.8 /100 | #48 | Exceptional 98.1% |
| Bulgarians | 99.8 /100 | #49 | Exceptional 98.1% |
| Immigrants | Scotland | 99.8 /100 | #50 | Exceptional 98.1% |
| Celtics | 99.8 /100 | #51 | Exceptional 98.1% |
| Australians | 99.8 /100 | #52 | Exceptional 98.1% |
| Slavs | 99.8 /100 | #53 | Exceptional 98.1% |
| Maltese | 99.8 /100 | #54 | Exceptional 98.1% |
| Whites/Caucasians | 99.8 /100 | #55 | Exceptional 98.1% |
| Greeks | 99.8 /100 | #56 | Exceptional 98.1% |
| Austrians | 99.8 /100 | #57 | Exceptional 98.1% |
| Creek | 99.8 /100 | #58 | Exceptional 98.1% |
| Americans | 99.8 /100 | #59 | Exceptional 98.1% |