Guamanian/Chamorro vs Immigrants from Poland Householder Income Under 25 years
COMPARE
Guamanian/Chamorro
Immigrants from Poland
Householder Income Under 25 years
Householder Income Under 25 years Comparison
Guamanians/Chamorros
Immigrants from Poland
$53,423
HOUSEHOLDER INCOME UNDER 25 YEARS
95.3/ 100
METRIC RATING
120th/ 347
METRIC RANK
$55,474
HOUSEHOLDER INCOME UNDER 25 YEARS
100.0/ 100
METRIC RATING
53rd/ 347
METRIC RANK
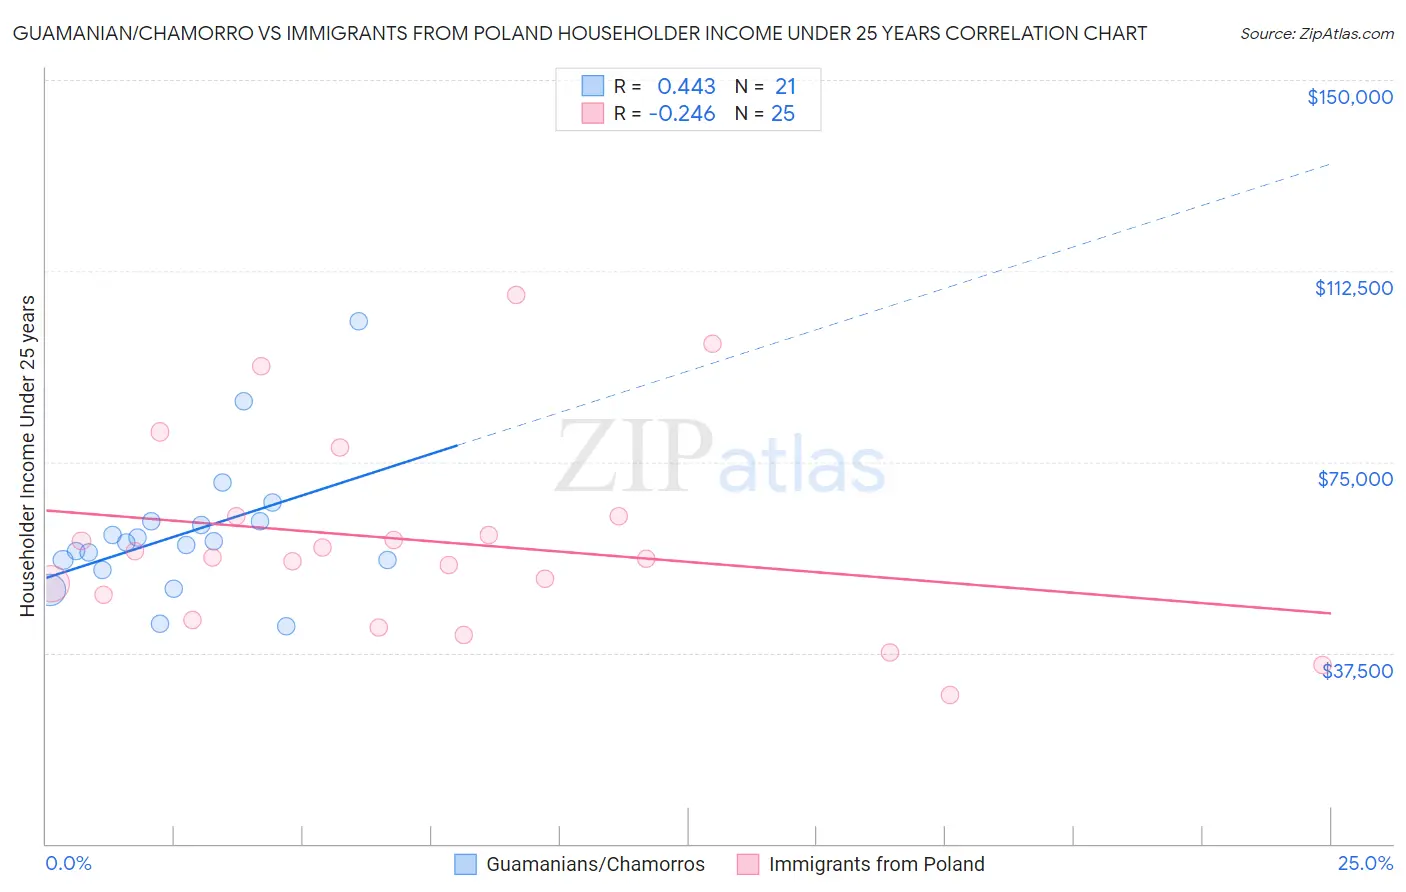
Guamanian/Chamorro vs Immigrants from Poland Householder Income Under 25 years Correlation Chart
The statistical analysis conducted on geographies consisting of 200,760,858 people shows a moderate positive correlation between the proportion of Guamanians/Chamorros and household income with householder under the age of 25 in the United States with a correlation coefficient (R) of 0.443 and weighted average of $53,423. Similarly, the statistical analysis conducted on geographies consisting of 255,465,653 people shows a weak negative correlation between the proportion of Immigrants from Poland and household income with householder under the age of 25 in the United States with a correlation coefficient (R) of -0.246 and weighted average of $55,474, a difference of 3.8%.
Householder Income Under 25 years Correlation Summary
| Measurement | Guamanian/Chamorro | Immigrants from Poland |
| Minimum | $42,829 | $29,167 |
| Maximum | $102,571 | $107,690 |
| Range | $59,742 | $78,523 |
| Mean | $60,959 | $59,420 |
| Median | $59,082 | $56,166 |
| Interquartile 25% (IQ1) | $54,739 | $46,340 |
| Interquartile 75% (IQ3) | $63,324 | $64,254 |
| Interquartile Range (IQR) | $8,585 | $17,913 |
| Standard Deviation (Sample) | $13,387 | $19,376 |
| Standard Deviation (Population) | $13,064 | $18,984 |
Similar Demographics by Householder Income Under 25 years
Demographics Similar to Guamanians/Chamorros by Householder Income Under 25 years
In terms of householder income under 25 years, the demographic groups most similar to Guamanians/Chamorros are Italian ($53,426, a difference of 0.010%), Immigrants from Canada ($53,411, a difference of 0.020%), Immigrants from Ethiopia ($53,408, a difference of 0.030%), Immigrants from Iraq ($53,384, a difference of 0.070%), and Colombian ($53,357, a difference of 0.12%).
| Demographics | Rating | Rank | Householder Income Under 25 years |
| Romanians | 97.2 /100 | #113 | Exceptional $53,632 |
| Immigrants | Sweden | 97.1 /100 | #114 | Exceptional $53,621 |
| Immigrants | Albania | 96.9 /100 | #115 | Exceptional $53,597 |
| Immigrants | Spain | 96.6 /100 | #116 | Exceptional $53,560 |
| Lithuanians | 96.6 /100 | #117 | Exceptional $53,552 |
| Immigrants | Switzerland | 96.3 /100 | #118 | Exceptional $53,528 |
| Italians | 95.4 /100 | #119 | Exceptional $53,426 |
| Guamanians/Chamorros | 95.3 /100 | #120 | Exceptional $53,423 |
| Immigrants | Canada | 95.2 /100 | #121 | Exceptional $53,411 |
| Immigrants | Ethiopia | 95.2 /100 | #122 | Exceptional $53,408 |
| Immigrants | Iraq | 94.9 /100 | #123 | Exceptional $53,384 |
| Colombians | 94.6 /100 | #124 | Exceptional $53,357 |
| Pakistanis | 94.1 /100 | #125 | Exceptional $53,325 |
| Immigrants | Serbia | 94.1 /100 | #126 | Exceptional $53,321 |
| Immigrants | North America | 93.9 /100 | #127 | Exceptional $53,307 |
Demographics Similar to Immigrants from Poland by Householder Income Under 25 years
In terms of householder income under 25 years, the demographic groups most similar to Immigrants from Poland are Sri Lankan ($55,470, a difference of 0.010%), Immigrants from Ukraine ($55,447, a difference of 0.050%), Immigrants from Indonesia ($55,521, a difference of 0.080%), Immigrants from Romania ($55,522, a difference of 0.090%), and Salvadoran ($55,412, a difference of 0.11%).
| Demographics | Rating | Rank | Householder Income Under 25 years |
| Immigrants | Eastern Europe | 100.0 /100 | #46 | Exceptional $55,572 |
| Cambodians | 100.0 /100 | #47 | Exceptional $55,571 |
| Immigrants | Vietnam | 100.0 /100 | #48 | Exceptional $55,562 |
| Iranians | 100.0 /100 | #49 | Exceptional $55,548 |
| Puget Sound Salish | 100.0 /100 | #50 | Exceptional $55,543 |
| Immigrants | Romania | 100.0 /100 | #51 | Exceptional $55,522 |
| Immigrants | Indonesia | 100.0 /100 | #52 | Exceptional $55,521 |
| Immigrants | Poland | 100.0 /100 | #53 | Exceptional $55,474 |
| Sri Lankans | 100.0 /100 | #54 | Exceptional $55,470 |
| Immigrants | Ukraine | 100.0 /100 | #55 | Exceptional $55,447 |
| Salvadorans | 100.0 /100 | #56 | Exceptional $55,412 |
| Soviet Union | 100.0 /100 | #57 | Exceptional $55,340 |
| Guyanese | 99.9 /100 | #58 | Exceptional $55,210 |
| Native Hawaiians | 99.9 /100 | #59 | Exceptional $55,158 |
| Immigrants | Lithuania | 99.9 /100 | #60 | Exceptional $55,028 |