Guamanian/Chamorro vs Italian Householder Income Under 25 years
COMPARE
Guamanian/Chamorro
Italian
Householder Income Under 25 years
Householder Income Under 25 years Comparison
Guamanians/Chamorros
Italians
$53,423
HOUSEHOLDER INCOME UNDER 25 YEARS
95.3/ 100
METRIC RATING
120th/ 347
METRIC RANK
$53,426
HOUSEHOLDER INCOME UNDER 25 YEARS
95.4/ 100
METRIC RATING
119th/ 347
METRIC RANK
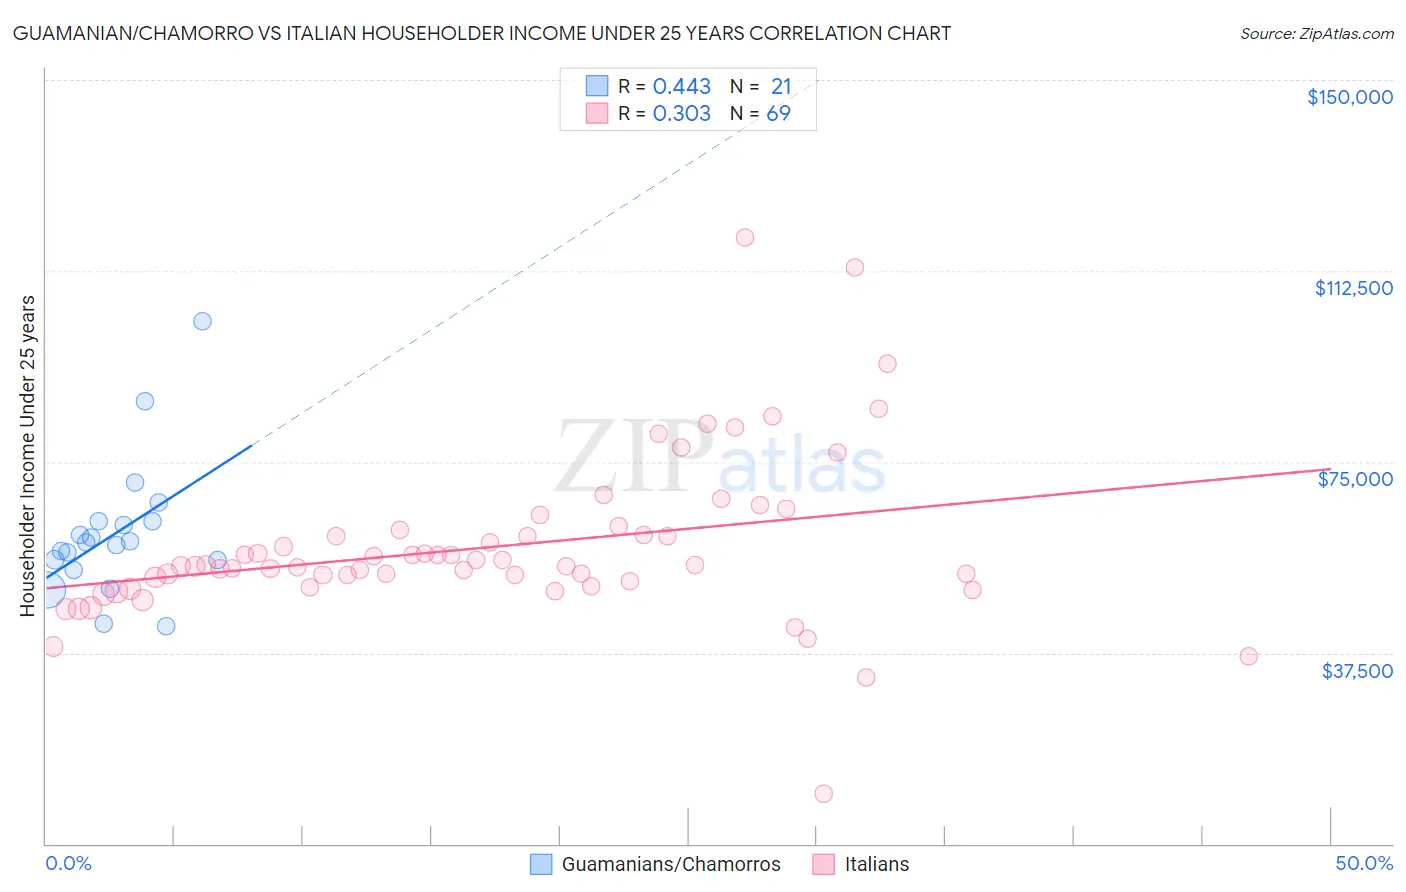
Guamanian/Chamorro vs Italian Householder Income Under 25 years Correlation Chart
The statistical analysis conducted on geographies consisting of 200,760,858 people shows a moderate positive correlation between the proportion of Guamanians/Chamorros and household income with householder under the age of 25 in the United States with a correlation coefficient (R) of 0.443 and weighted average of $53,423. Similarly, the statistical analysis conducted on geographies consisting of 440,319,823 people shows a mild positive correlation between the proportion of Italians and household income with householder under the age of 25 in the United States with a correlation coefficient (R) of 0.303 and weighted average of $53,426, a difference of 0.010%.
Householder Income Under 25 years Correlation Summary
| Measurement | Guamanian/Chamorro | Italian |
| Minimum | $42,829 | $9,706 |
| Maximum | $102,571 | $119,083 |
| Range | $59,742 | $109,377 |
| Mean | $60,959 | $58,363 |
| Median | $59,082 | $54,623 |
| Interquartile 25% (IQ1) | $54,739 | $51,021 |
| Interquartile 75% (IQ3) | $63,324 | $61,158 |
| Interquartile Range (IQR) | $8,585 | $10,138 |
| Standard Deviation (Sample) | $13,387 | $16,327 |
| Standard Deviation (Population) | $13,064 | $16,208 |
Demographics Similar to Guamanians/Chamorros and Italians by Householder Income Under 25 years
In terms of householder income under 25 years, the demographic groups most similar to Guamanians/Chamorros are Immigrants from Canada ($53,411, a difference of 0.020%), Immigrants from Ethiopia ($53,408, a difference of 0.030%), Immigrants from Iraq ($53,384, a difference of 0.070%), Colombian ($53,357, a difference of 0.12%), and Pakistani ($53,325, a difference of 0.18%). Similarly, the demographic groups most similar to Italians are Immigrants from Canada ($53,411, a difference of 0.030%), Immigrants from Ethiopia ($53,408, a difference of 0.030%), Immigrants from Iraq ($53,384, a difference of 0.080%), Colombian ($53,357, a difference of 0.13%), and Immigrants from Switzerland ($53,528, a difference of 0.19%).
| Demographics | Rating | Rank | Householder Income Under 25 years |
| Immigrants | Ecuador | 97.7 /100 | #109 | Exceptional $53,722 |
| Greeks | 97.7 /100 | #110 | Exceptional $53,715 |
| Immigrants | Colombia | 97.7 /100 | #111 | Exceptional $53,714 |
| Immigrants | Oceania | 97.5 /100 | #112 | Exceptional $53,680 |
| Romanians | 97.2 /100 | #113 | Exceptional $53,632 |
| Immigrants | Sweden | 97.1 /100 | #114 | Exceptional $53,621 |
| Immigrants | Albania | 96.9 /100 | #115 | Exceptional $53,597 |
| Immigrants | Spain | 96.6 /100 | #116 | Exceptional $53,560 |
| Lithuanians | 96.6 /100 | #117 | Exceptional $53,552 |
| Immigrants | Switzerland | 96.3 /100 | #118 | Exceptional $53,528 |
| Italians | 95.4 /100 | #119 | Exceptional $53,426 |
| Guamanians/Chamorros | 95.3 /100 | #120 | Exceptional $53,423 |
| Immigrants | Canada | 95.2 /100 | #121 | Exceptional $53,411 |
| Immigrants | Ethiopia | 95.2 /100 | #122 | Exceptional $53,408 |
| Immigrants | Iraq | 94.9 /100 | #123 | Exceptional $53,384 |
| Colombians | 94.6 /100 | #124 | Exceptional $53,357 |
| Pakistanis | 94.1 /100 | #125 | Exceptional $53,325 |
| Immigrants | Serbia | 94.1 /100 | #126 | Exceptional $53,321 |
| Immigrants | North America | 93.9 /100 | #127 | Exceptional $53,307 |
| Immigrants | Bulgaria | 93.9 /100 | #128 | Exceptional $53,305 |
| New Zealanders | 93.7 /100 | #129 | Exceptional $53,294 |