Trinidadian and Tobagonian vs Hawaiian Householder Income Under 25 years
COMPARE
Trinidadian and Tobagonian
Hawaiian
Householder Income Under 25 years
Householder Income Under 25 years Comparison
Trinidadians and Tobagonians
Hawaiians
$52,631
HOUSEHOLDER INCOME UNDER 25 YEARS
74.6/ 100
METRIC RATING
152nd/ 347
METRIC RANK
$53,078
HOUSEHOLDER INCOME UNDER 25 YEARS
89.8/ 100
METRIC RATING
140th/ 347
METRIC RANK
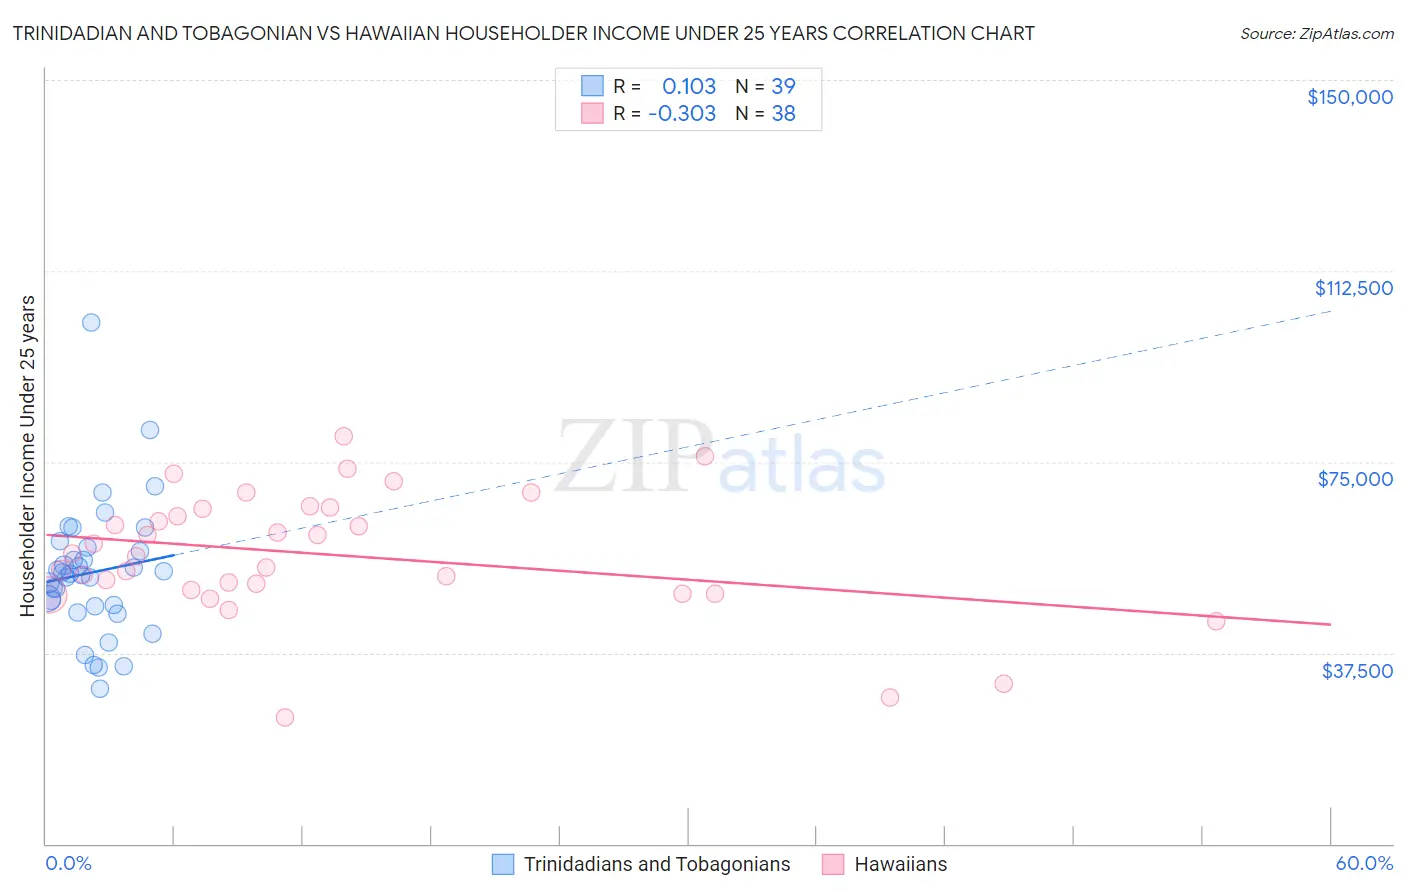
Trinidadian and Tobagonian vs Hawaiian Householder Income Under 25 years Correlation Chart
The statistical analysis conducted on geographies consisting of 193,000,930 people shows a poor positive correlation between the proportion of Trinidadians and Tobagonians and household income with householder under the age of 25 in the United States with a correlation coefficient (R) of 0.103 and weighted average of $52,631. Similarly, the statistical analysis conducted on geographies consisting of 288,171,696 people shows a mild negative correlation between the proportion of Hawaiians and household income with householder under the age of 25 in the United States with a correlation coefficient (R) of -0.303 and weighted average of $53,078, a difference of 0.85%.
Householder Income Under 25 years Correlation Summary
| Measurement | Trinidadian and Tobagonian | Hawaiian |
| Minimum | $30,455 | $24,709 |
| Maximum | $102,312 | $80,098 |
| Range | $71,857 | $55,389 |
| Mean | $53,317 | $56,783 |
| Median | $52,934 | $56,779 |
| Interquartile 25% (IQ1) | $46,536 | $49,786 |
| Interquartile 75% (IQ3) | $58,164 | $65,721 |
| Interquartile Range (IQR) | $11,628 | $15,935 |
| Standard Deviation (Sample) | $13,212 | $12,327 |
| Standard Deviation (Population) | $13,042 | $12,164 |
Demographics Similar to Trinidadians and Tobagonians and Hawaiians by Householder Income Under 25 years
In terms of householder income under 25 years, the demographic groups most similar to Trinidadians and Tobagonians are Immigrants from Scotland ($52,638, a difference of 0.010%), Central American ($52,626, a difference of 0.010%), Immigrants from Costa Rica ($52,643, a difference of 0.020%), Immigrants from the Azores ($52,621, a difference of 0.020%), and Scandinavian ($52,654, a difference of 0.040%). Similarly, the demographic groups most similar to Hawaiians are Costa Rican ($53,106, a difference of 0.050%), Danish ($53,041, a difference of 0.070%), Norwegian ($53,127, a difference of 0.090%), Immigrants from Barbados ($53,163, a difference of 0.16%), and Immigrants from Armenia ($52,986, a difference of 0.17%).
| Demographics | Rating | Rank | Householder Income Under 25 years |
| Armenians | 91.8 /100 | #136 | Exceptional $53,179 |
| Immigrants | Barbados | 91.5 /100 | #137 | Exceptional $53,163 |
| Norwegians | 90.8 /100 | #138 | Exceptional $53,127 |
| Costa Ricans | 90.4 /100 | #139 | Exceptional $53,106 |
| Hawaiians | 89.8 /100 | #140 | Excellent $53,078 |
| Danes | 88.9 /100 | #141 | Excellent $53,041 |
| Immigrants | Armenia | 87.5 /100 | #142 | Excellent $52,986 |
| Swedes | 87.5 /100 | #143 | Excellent $52,986 |
| South American Indians | 87.3 /100 | #144 | Excellent $52,979 |
| Immigrants | Western Europe | 86.7 /100 | #145 | Excellent $52,957 |
| Immigrants | Hungary | 81.6 /100 | #146 | Excellent $52,798 |
| Latvians | 81.0 /100 | #147 | Excellent $52,783 |
| French Canadians | 76.5 /100 | #148 | Good $52,672 |
| Scandinavians | 75.7 /100 | #149 | Good $52,654 |
| Immigrants | Costa Rica | 75.2 /100 | #150 | Good $52,643 |
| Immigrants | Scotland | 75.0 /100 | #151 | Good $52,638 |
| Trinidadians and Tobagonians | 74.6 /100 | #152 | Good $52,631 |
| Central Americans | 74.4 /100 | #153 | Good $52,626 |
| Immigrants | Azores | 74.2 /100 | #154 | Good $52,621 |
| Immigrants | Denmark | 73.8 /100 | #155 | Good $52,612 |
| Immigrants | Nepal | 73.7 /100 | #156 | Good $52,611 |