Guamanian/Chamorro vs Apache Householder Income Under 25 years
COMPARE
Guamanian/Chamorro
Apache
Householder Income Under 25 years
Householder Income Under 25 years Comparison
Guamanians/Chamorros
Apache
$53,423
HOUSEHOLDER INCOME UNDER 25 YEARS
95.3/ 100
METRIC RATING
120th/ 347
METRIC RANK
$49,395
HOUSEHOLDER INCOME UNDER 25 YEARS
0.1/ 100
METRIC RATING
279th/ 347
METRIC RANK
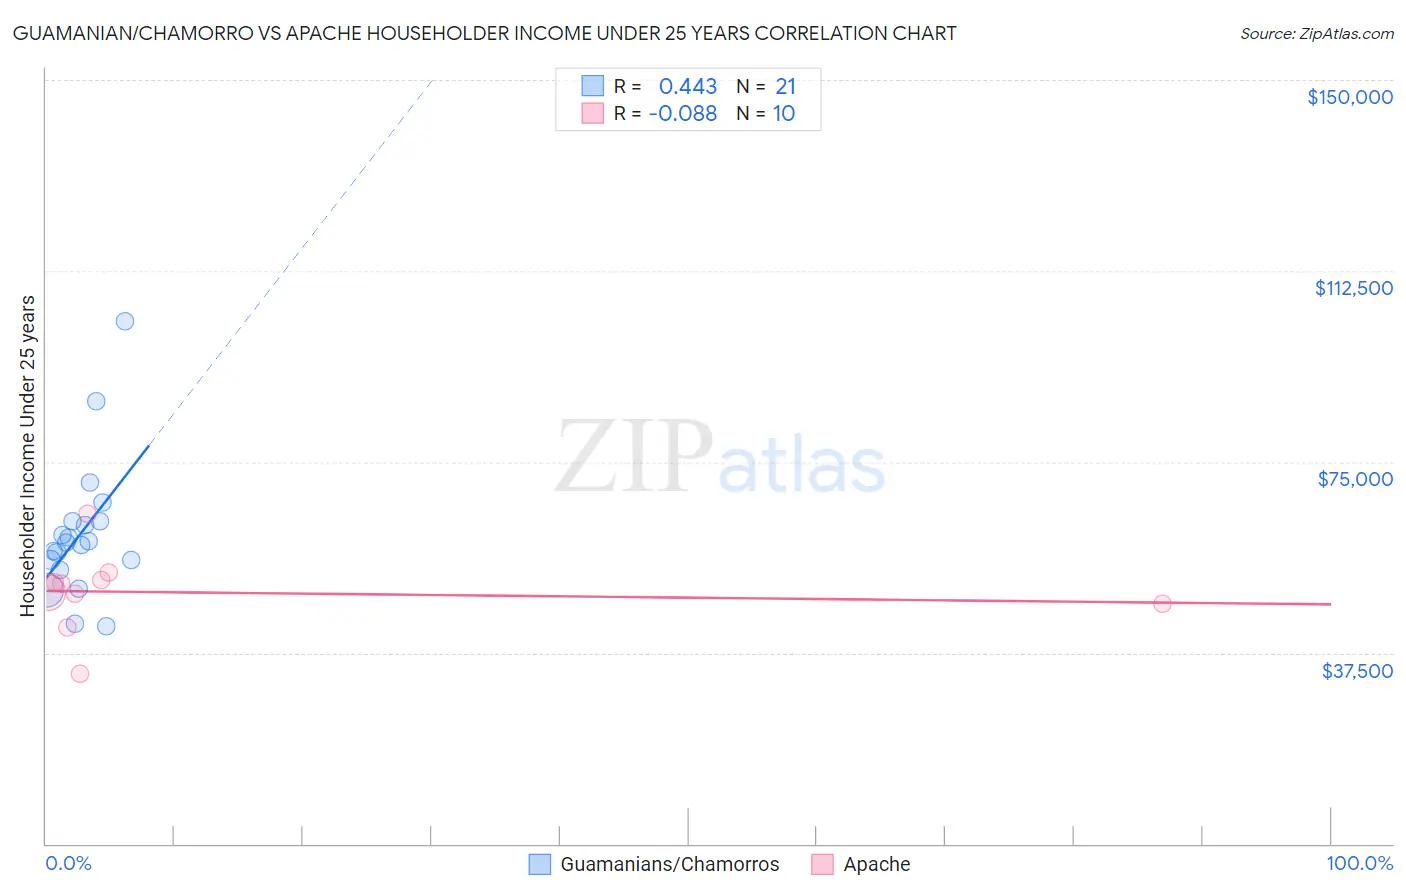
Guamanian/Chamorro vs Apache Householder Income Under 25 years Correlation Chart
The statistical analysis conducted on geographies consisting of 200,760,858 people shows a moderate positive correlation between the proportion of Guamanians/Chamorros and household income with householder under the age of 25 in the United States with a correlation coefficient (R) of 0.443 and weighted average of $53,423. Similarly, the statistical analysis conducted on geographies consisting of 208,884,010 people shows a slight negative correlation between the proportion of Apache and household income with householder under the age of 25 in the United States with a correlation coefficient (R) of -0.088 and weighted average of $49,395, a difference of 8.2%.
Householder Income Under 25 years Correlation Summary
| Measurement | Guamanian/Chamorro | Apache |
| Minimum | $42,829 | $33,347 |
| Maximum | $102,571 | $64,911 |
| Range | $59,742 | $31,564 |
| Mean | $60,959 | $49,372 |
| Median | $59,082 | $50,154 |
| Interquartile 25% (IQ1) | $54,739 | $47,083 |
| Interquartile 75% (IQ3) | $63,324 | $51,895 |
| Interquartile Range (IQR) | $8,585 | $4,812 |
| Standard Deviation (Sample) | $13,387 | $8,028 |
| Standard Deviation (Population) | $13,064 | $7,616 |
Similar Demographics by Householder Income Under 25 years
Demographics Similar to Guamanians/Chamorros by Householder Income Under 25 years
In terms of householder income under 25 years, the demographic groups most similar to Guamanians/Chamorros are Italian ($53,426, a difference of 0.010%), Immigrants from Canada ($53,411, a difference of 0.020%), Immigrants from Ethiopia ($53,408, a difference of 0.030%), Immigrants from Iraq ($53,384, a difference of 0.070%), and Colombian ($53,357, a difference of 0.12%).
| Demographics | Rating | Rank | Householder Income Under 25 years |
| Romanians | 97.2 /100 | #113 | Exceptional $53,632 |
| Immigrants | Sweden | 97.1 /100 | #114 | Exceptional $53,621 |
| Immigrants | Albania | 96.9 /100 | #115 | Exceptional $53,597 |
| Immigrants | Spain | 96.6 /100 | #116 | Exceptional $53,560 |
| Lithuanians | 96.6 /100 | #117 | Exceptional $53,552 |
| Immigrants | Switzerland | 96.3 /100 | #118 | Exceptional $53,528 |
| Italians | 95.4 /100 | #119 | Exceptional $53,426 |
| Guamanians/Chamorros | 95.3 /100 | #120 | Exceptional $53,423 |
| Immigrants | Canada | 95.2 /100 | #121 | Exceptional $53,411 |
| Immigrants | Ethiopia | 95.2 /100 | #122 | Exceptional $53,408 |
| Immigrants | Iraq | 94.9 /100 | #123 | Exceptional $53,384 |
| Colombians | 94.6 /100 | #124 | Exceptional $53,357 |
| Pakistanis | 94.1 /100 | #125 | Exceptional $53,325 |
| Immigrants | Serbia | 94.1 /100 | #126 | Exceptional $53,321 |
| Immigrants | North America | 93.9 /100 | #127 | Exceptional $53,307 |
Demographics Similar to Apache by Householder Income Under 25 years
In terms of householder income under 25 years, the demographic groups most similar to Apache are Nigerian ($49,416, a difference of 0.040%), Hmong ($49,364, a difference of 0.060%), Nonimmigrants ($49,348, a difference of 0.090%), Alsatian ($49,267, a difference of 0.26%), and Immigrants from Nigeria ($49,174, a difference of 0.45%).
| Demographics | Rating | Rank | Householder Income Under 25 years |
| Colville | 0.3 /100 | #272 | Tragic $49,774 |
| Slovaks | 0.3 /100 | #273 | Tragic $49,753 |
| Immigrants | Senegal | 0.3 /100 | #274 | Tragic $49,742 |
| Immigrants | Kenya | 0.2 /100 | #275 | Tragic $49,633 |
| Dominicans | 0.2 /100 | #276 | Tragic $49,633 |
| Immigrants | Western Africa | 0.2 /100 | #277 | Tragic $49,621 |
| Nigerians | 0.1 /100 | #278 | Tragic $49,416 |
| Apache | 0.1 /100 | #279 | Tragic $49,395 |
| Hmong | 0.1 /100 | #280 | Tragic $49,364 |
| Immigrants | Nonimmigrants | 0.1 /100 | #281 | Tragic $49,348 |
| Alsatians | 0.1 /100 | #282 | Tragic $49,267 |
| Immigrants | Nigeria | 0.1 /100 | #283 | Tragic $49,174 |
| Carpatho Rusyns | 0.1 /100 | #284 | Tragic $49,113 |
| Scotch-Irish | 0.0 /100 | #285 | Tragic $49,039 |
| French American Indians | 0.0 /100 | #286 | Tragic $48,977 |