Greek vs Iranian Doctorate Degree
COMPARE
Greek
Iranian
Doctorate Degree
Doctorate Degree Comparison
Greeks
Iranians
2.1%
DOCTORATE DEGREE
98.8/ 100
METRIC RATING
94th/ 347
METRIC RANK
3.1%
DOCTORATE DEGREE
100.0/ 100
METRIC RATING
5th/ 347
METRIC RANK
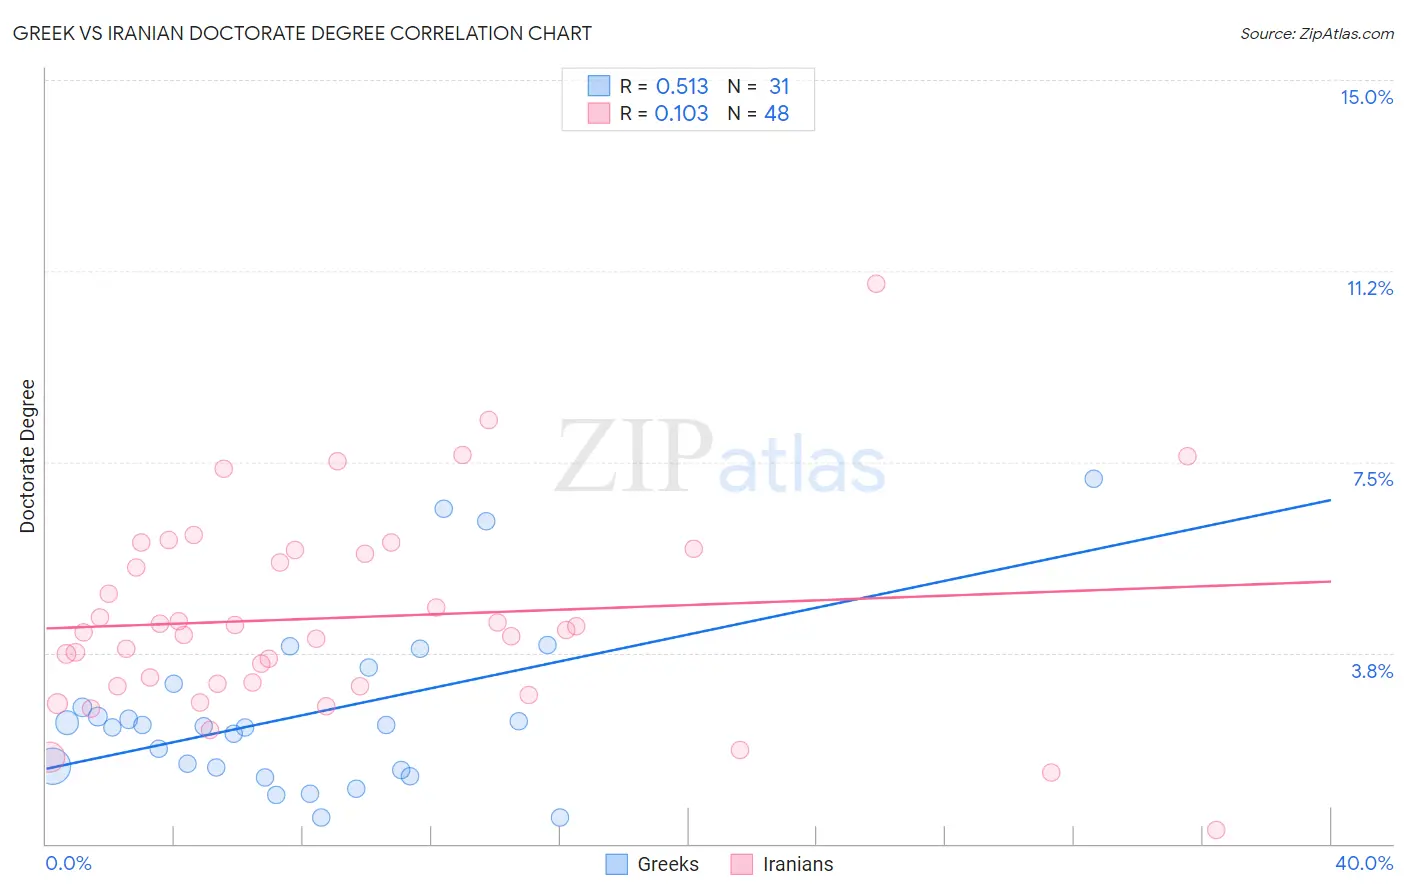
Greek vs Iranian Doctorate Degree Correlation Chart
The statistical analysis conducted on geographies consisting of 475,132,187 people shows a substantial positive correlation between the proportion of Greeks and percentage of population with at least doctorate degree education in the United States with a correlation coefficient (R) of 0.513 and weighted average of 2.1%. Similarly, the statistical analysis conducted on geographies consisting of 315,770,820 people shows a poor positive correlation between the proportion of Iranians and percentage of population with at least doctorate degree education in the United States with a correlation coefficient (R) of 0.103 and weighted average of 3.1%, a difference of 47.5%.
Doctorate Degree Correlation Summary
| Measurement | Greek | Iranian |
| Minimum | 0.51% | 0.26% |
| Maximum | 7.2% | 11.0% |
| Range | 6.7% | 10.7% |
| Mean | 2.5% | 4.4% |
| Median | 2.3% | 4.2% |
| Interquartile 25% (IQ1) | 1.5% | 3.1% |
| Interquartile 75% (IQ3) | 3.1% | 5.7% |
| Interquartile Range (IQR) | 1.7% | 2.6% |
| Standard Deviation (Sample) | 1.7% | 2.0% |
| Standard Deviation (Population) | 1.6% | 2.0% |
Similar Demographics by Doctorate Degree
Demographics Similar to Greeks by Doctorate Degree
In terms of doctorate degree, the demographic groups most similar to Greeks are Immigrants from Romania (2.1%, a difference of 0.15%), Alsatian (2.1%, a difference of 0.64%), Immigrants from Northern Africa (2.1%, a difference of 0.73%), Chilean (2.2%, a difference of 0.85%), and Immigrants from Eritrea (2.1%, a difference of 0.87%).
| Demographics | Rating | Rank | Doctorate Degree |
| Immigrants | Zimbabwe | 99.4 /100 | #87 | Exceptional 2.2% |
| Immigrants | Nepal | 99.3 /100 | #88 | Exceptional 2.2% |
| British | 99.3 /100 | #89 | Exceptional 2.2% |
| Immigrants | Scotland | 99.2 /100 | #90 | Exceptional 2.2% |
| Immigrants | Sudan | 99.1 /100 | #91 | Exceptional 2.2% |
| Chileans | 99.1 /100 | #92 | Exceptional 2.2% |
| Alsatians | 99.0 /100 | #93 | Exceptional 2.1% |
| Greeks | 98.8 /100 | #94 | Exceptional 2.1% |
| Immigrants | Romania | 98.7 /100 | #95 | Exceptional 2.1% |
| Immigrants | Northern Africa | 98.4 /100 | #96 | Exceptional 2.1% |
| Immigrants | Eritrea | 98.4 /100 | #97 | Exceptional 2.1% |
| Armenians | 98.3 /100 | #98 | Exceptional 2.1% |
| Immigrants | Egypt | 98.2 /100 | #99 | Exceptional 2.1% |
| Immigrants | Eastern Europe | 98.2 /100 | #100 | Exceptional 2.1% |
| Immigrants | Eastern Africa | 98.2 /100 | #101 | Exceptional 2.1% |
Demographics Similar to Iranians by Doctorate Degree
In terms of doctorate degree, the demographic groups most similar to Iranians are Immigrants from Taiwan (3.2%, a difference of 1.5%), Immigrants from Switzerland (3.1%, a difference of 1.9%), Immigrants from China (3.1%, a difference of 2.0%), Immigrants from Israel (3.0%, a difference of 3.3%), and Immigrants from Iran (3.0%, a difference of 4.0%).
| Demographics | Rating | Rank | Doctorate Degree |
| Immigrants | Singapore | 100.0 /100 | #1 | Exceptional 3.7% |
| Filipinos | 100.0 /100 | #2 | Exceptional 3.4% |
| Okinawans | 100.0 /100 | #3 | Exceptional 3.3% |
| Immigrants | Taiwan | 100.0 /100 | #4 | Exceptional 3.2% |
| Iranians | 100.0 /100 | #5 | Exceptional 3.1% |
| Immigrants | Switzerland | 100.0 /100 | #6 | Exceptional 3.1% |
| Immigrants | China | 100.0 /100 | #7 | Exceptional 3.1% |
| Immigrants | Israel | 100.0 /100 | #8 | Exceptional 3.0% |
| Immigrants | Iran | 100.0 /100 | #9 | Exceptional 3.0% |
| Immigrants | Eastern Asia | 100.0 /100 | #10 | Exceptional 3.0% |
| Indians (Asian) | 100.0 /100 | #11 | Exceptional 2.9% |
| Immigrants | Belgium | 100.0 /100 | #12 | Exceptional 2.9% |
| Immigrants | Sweden | 100.0 /100 | #13 | Exceptional 2.9% |
| Immigrants | France | 100.0 /100 | #14 | Exceptional 2.9% |
| Immigrants | India | 100.0 /100 | #15 | Exceptional 2.8% |