Immigrants from Belize vs Immigrants from North America Median Male Earnings
COMPARE
Immigrants from Belize
Immigrants from North America
Median Male Earnings
Median Male Earnings Comparison
Immigrants from Belize
Immigrants from North America
$47,809
MEDIAN MALE EARNINGS
0.1/ 100
METRIC RATING
290th/ 347
METRIC RANK
$60,265
MEDIAN MALE EARNINGS
99.7/ 100
METRIC RATING
73rd/ 347
METRIC RANK
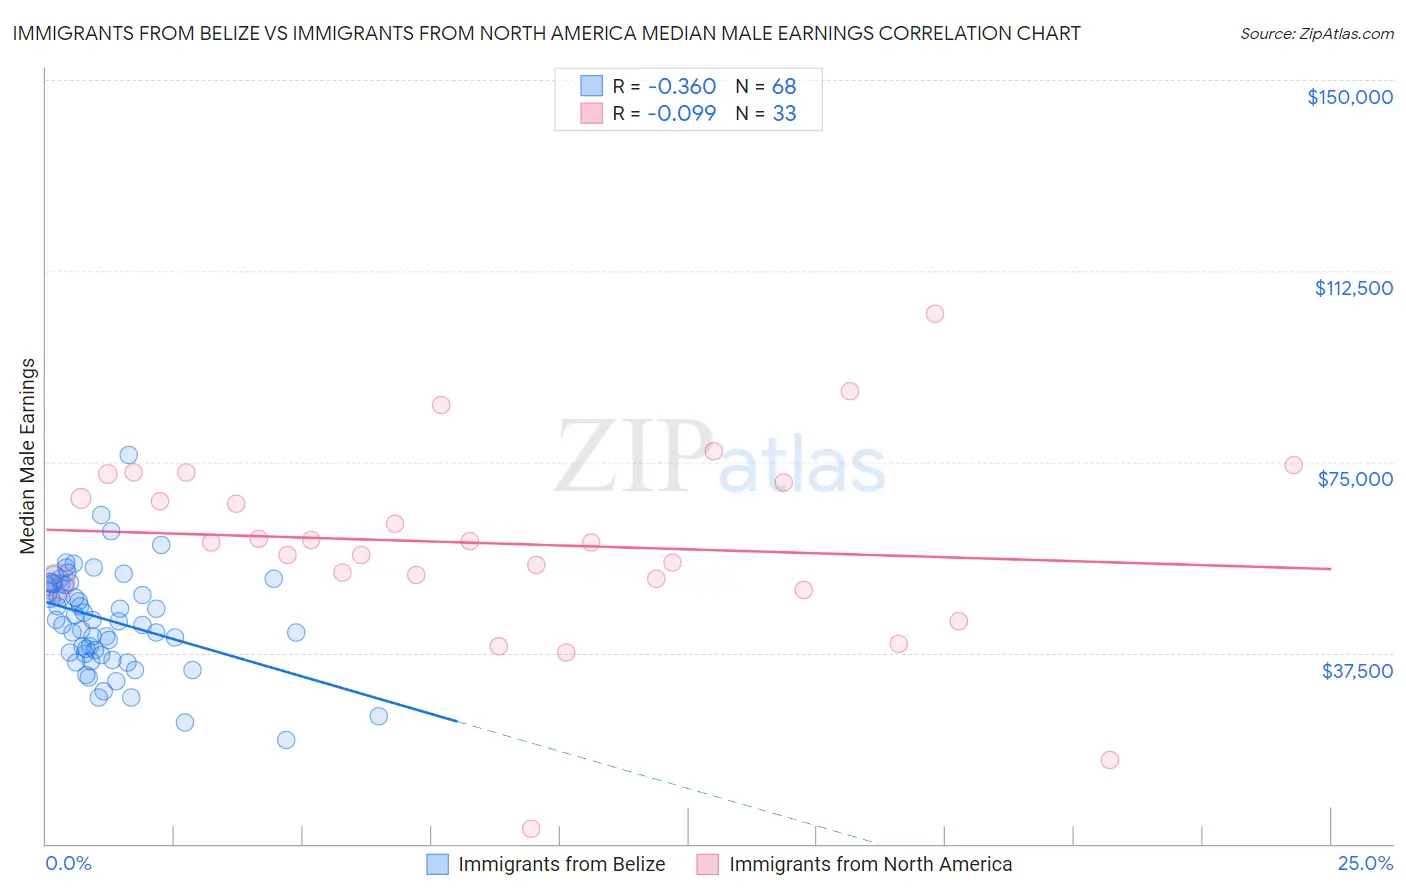
Immigrants from Belize vs Immigrants from North America Median Male Earnings Correlation Chart
The statistical analysis conducted on geographies consisting of 130,305,697 people shows a mild negative correlation between the proportion of Immigrants from Belize and median male earnings in the United States with a correlation coefficient (R) of -0.360 and weighted average of $47,809. Similarly, the statistical analysis conducted on geographies consisting of 462,182,608 people shows a slight negative correlation between the proportion of Immigrants from North America and median male earnings in the United States with a correlation coefficient (R) of -0.099 and weighted average of $60,265, a difference of 26.1%.
Median Male Earnings Correlation Summary
| Measurement | Immigrants from Belize | Immigrants from North America |
| Minimum | $20,292 | $2,875 |
| Maximum | $76,469 | $104,091 |
| Range | $56,177 | $101,216 |
| Mean | $44,004 | $58,890 |
| Median | $43,946 | $59,220 |
| Interquartile 25% (IQ1) | $37,392 | $51,688 |
| Interquartile 75% (IQ3) | $51,048 | $71,762 |
| Interquartile Range (IQR) | $13,656 | $20,074 |
| Standard Deviation (Sample) | $9,886 | $19,290 |
| Standard Deviation (Population) | $9,813 | $18,995 |
Similar Demographics by Median Male Earnings
Demographics Similar to Immigrants from Belize by Median Male Earnings
In terms of median male earnings, the demographic groups most similar to Immigrants from Belize are Chickasaw ($47,832, a difference of 0.050%), Choctaw ($47,729, a difference of 0.17%), Shoshone ($47,930, a difference of 0.25%), Immigrants from Dominica ($47,651, a difference of 0.33%), and Immigrants from El Salvador ($47,973, a difference of 0.34%).
| Demographics | Rating | Rank | Median Male Earnings |
| Immigrants | Jamaica | 0.2 /100 | #283 | Tragic $48,040 |
| Africans | 0.2 /100 | #284 | Tragic $47,994 |
| Paiute | 0.2 /100 | #285 | Tragic $47,991 |
| Mexican American Indians | 0.2 /100 | #286 | Tragic $47,990 |
| Immigrants | El Salvador | 0.2 /100 | #287 | Tragic $47,973 |
| Shoshone | 0.2 /100 | #288 | Tragic $47,930 |
| Chickasaw | 0.1 /100 | #289 | Tragic $47,832 |
| Immigrants | Belize | 0.1 /100 | #290 | Tragic $47,809 |
| Choctaw | 0.1 /100 | #291 | Tragic $47,729 |
| Immigrants | Dominica | 0.1 /100 | #292 | Tragic $47,651 |
| Indonesians | 0.1 /100 | #293 | Tragic $47,503 |
| Immigrants | Nicaragua | 0.1 /100 | #294 | Tragic $47,482 |
| Central American Indians | 0.1 /100 | #295 | Tragic $47,433 |
| Inupiat | 0.1 /100 | #296 | Tragic $47,281 |
| Dominicans | 0.1 /100 | #297 | Tragic $47,204 |
Demographics Similar to Immigrants from North America by Median Male Earnings
In terms of median male earnings, the demographic groups most similar to Immigrants from North America are Immigrants from Western Europe ($60,334, a difference of 0.12%), Mongolian ($60,350, a difference of 0.14%), Immigrants from Bulgaria ($60,358, a difference of 0.16%), Immigrants from Canada ($60,388, a difference of 0.20%), and Argentinean ($60,117, a difference of 0.25%).
| Demographics | Rating | Rank | Median Male Earnings |
| Immigrants | Croatia | 99.8 /100 | #66 | Exceptional $60,914 |
| Immigrants | Spain | 99.8 /100 | #67 | Exceptional $60,750 |
| Immigrants | Serbia | 99.7 /100 | #68 | Exceptional $60,600 |
| Immigrants | Canada | 99.7 /100 | #69 | Exceptional $60,388 |
| Immigrants | Bulgaria | 99.7 /100 | #70 | Exceptional $60,358 |
| Mongolians | 99.7 /100 | #71 | Exceptional $60,350 |
| Immigrants | Western Europe | 99.7 /100 | #72 | Exceptional $60,334 |
| Immigrants | North America | 99.7 /100 | #73 | Exceptional $60,265 |
| Argentineans | 99.6 /100 | #74 | Exceptional $60,117 |
| Immigrants | Bolivia | 99.6 /100 | #75 | Exceptional $60,088 |
| Romanians | 99.6 /100 | #76 | Exceptional $60,063 |
| Paraguayans | 99.5 /100 | #77 | Exceptional $59,975 |
| Immigrants | Egypt | 99.5 /100 | #78 | Exceptional $59,925 |
| Immigrants | Ukraine | 99.5 /100 | #79 | Exceptional $59,820 |
| Immigrants | Hungary | 99.5 /100 | #80 | Exceptional $59,806 |