New Zealander vs Immigrants from North America Median Male Earnings
COMPARE
New Zealander
Immigrants from North America
Median Male Earnings
Median Male Earnings Comparison
New Zealanders
Immigrants from North America
$61,199
MEDIAN MALE EARNINGS
99.9/ 100
METRIC RATING
58th/ 347
METRIC RANK
$60,265
MEDIAN MALE EARNINGS
99.7/ 100
METRIC RATING
73rd/ 347
METRIC RANK
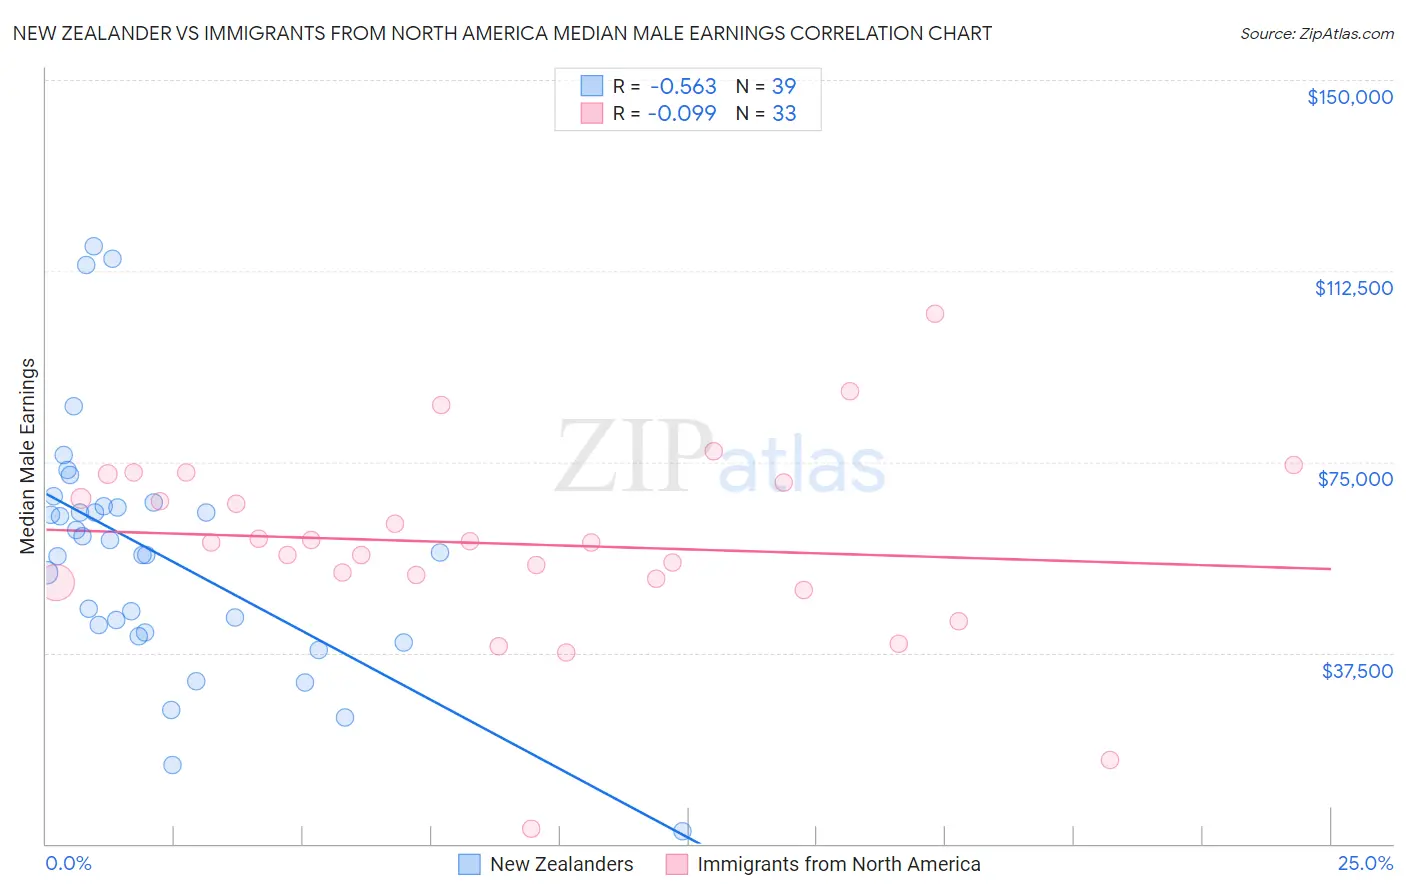
New Zealander vs Immigrants from North America Median Male Earnings Correlation Chart
The statistical analysis conducted on geographies consisting of 106,908,736 people shows a substantial negative correlation between the proportion of New Zealanders and median male earnings in the United States with a correlation coefficient (R) of -0.563 and weighted average of $61,199. Similarly, the statistical analysis conducted on geographies consisting of 462,182,608 people shows a slight negative correlation between the proportion of Immigrants from North America and median male earnings in the United States with a correlation coefficient (R) of -0.099 and weighted average of $60,265, a difference of 1.5%.
Median Male Earnings Correlation Summary
| Measurement | New Zealander | Immigrants from North America |
| Minimum | $2,499 | $2,875 |
| Maximum | $117,445 | $104,091 |
| Range | $114,946 | $101,216 |
| Mean | $57,008 | $58,890 |
| Median | $57,308 | $59,220 |
| Interquartile 25% (IQ1) | $41,429 | $51,688 |
| Interquartile 75% (IQ3) | $66,406 | $71,762 |
| Interquartile Range (IQR) | $24,977 | $20,074 |
| Standard Deviation (Sample) | $24,372 | $19,290 |
| Standard Deviation (Population) | $24,057 | $18,995 |
Demographics Similar to New Zealanders and Immigrants from North America by Median Male Earnings
In terms of median male earnings, the demographic groups most similar to New Zealanders are Immigrants from Scotland ($61,220, a difference of 0.030%), Lithuanian ($61,228, a difference of 0.050%), Greek ($61,242, a difference of 0.070%), Immigrants from Netherlands ($61,096, a difference of 0.17%), and Egyptian ($61,095, a difference of 0.17%). Similarly, the demographic groups most similar to Immigrants from North America are Immigrants from Western Europe ($60,334, a difference of 0.12%), Mongolian ($60,350, a difference of 0.14%), Immigrants from Bulgaria ($60,358, a difference of 0.16%), Immigrants from Canada ($60,388, a difference of 0.20%), and Argentinean ($60,117, a difference of 0.25%).
| Demographics | Rating | Rank | Median Male Earnings |
| Greeks | 99.9 /100 | #55 | Exceptional $61,242 |
| Lithuanians | 99.9 /100 | #56 | Exceptional $61,228 |
| Immigrants | Scotland | 99.9 /100 | #57 | Exceptional $61,220 |
| New Zealanders | 99.9 /100 | #58 | Exceptional $61,199 |
| Immigrants | Netherlands | 99.8 /100 | #59 | Exceptional $61,096 |
| Egyptians | 99.8 /100 | #60 | Exceptional $61,095 |
| Bolivians | 99.8 /100 | #61 | Exceptional $61,066 |
| Immigrants | Romania | 99.8 /100 | #62 | Exceptional $61,040 |
| Immigrants | Pakistan | 99.8 /100 | #63 | Exceptional $60,987 |
| Immigrants | Eastern Europe | 99.8 /100 | #64 | Exceptional $60,958 |
| Immigrants | Indonesia | 99.8 /100 | #65 | Exceptional $60,935 |
| Immigrants | Croatia | 99.8 /100 | #66 | Exceptional $60,914 |
| Immigrants | Spain | 99.8 /100 | #67 | Exceptional $60,750 |
| Immigrants | Serbia | 99.7 /100 | #68 | Exceptional $60,600 |
| Immigrants | Canada | 99.7 /100 | #69 | Exceptional $60,388 |
| Immigrants | Bulgaria | 99.7 /100 | #70 | Exceptional $60,358 |
| Mongolians | 99.7 /100 | #71 | Exceptional $60,350 |
| Immigrants | Western Europe | 99.7 /100 | #72 | Exceptional $60,334 |
| Immigrants | North America | 99.7 /100 | #73 | Exceptional $60,265 |
| Argentineans | 99.6 /100 | #74 | Exceptional $60,117 |
| Immigrants | Bolivia | 99.6 /100 | #75 | Exceptional $60,088 |