Immigrants from Sudan vs Immigrants from North America Median Male Earnings
COMPARE
Immigrants from Sudan
Immigrants from North America
Median Male Earnings
Median Male Earnings Comparison
Immigrants from Sudan
Immigrants from North America
$51,489
MEDIAN MALE EARNINGS
5.0/ 100
METRIC RATING
225th/ 347
METRIC RANK
$60,265
MEDIAN MALE EARNINGS
99.7/ 100
METRIC RATING
73rd/ 347
METRIC RANK
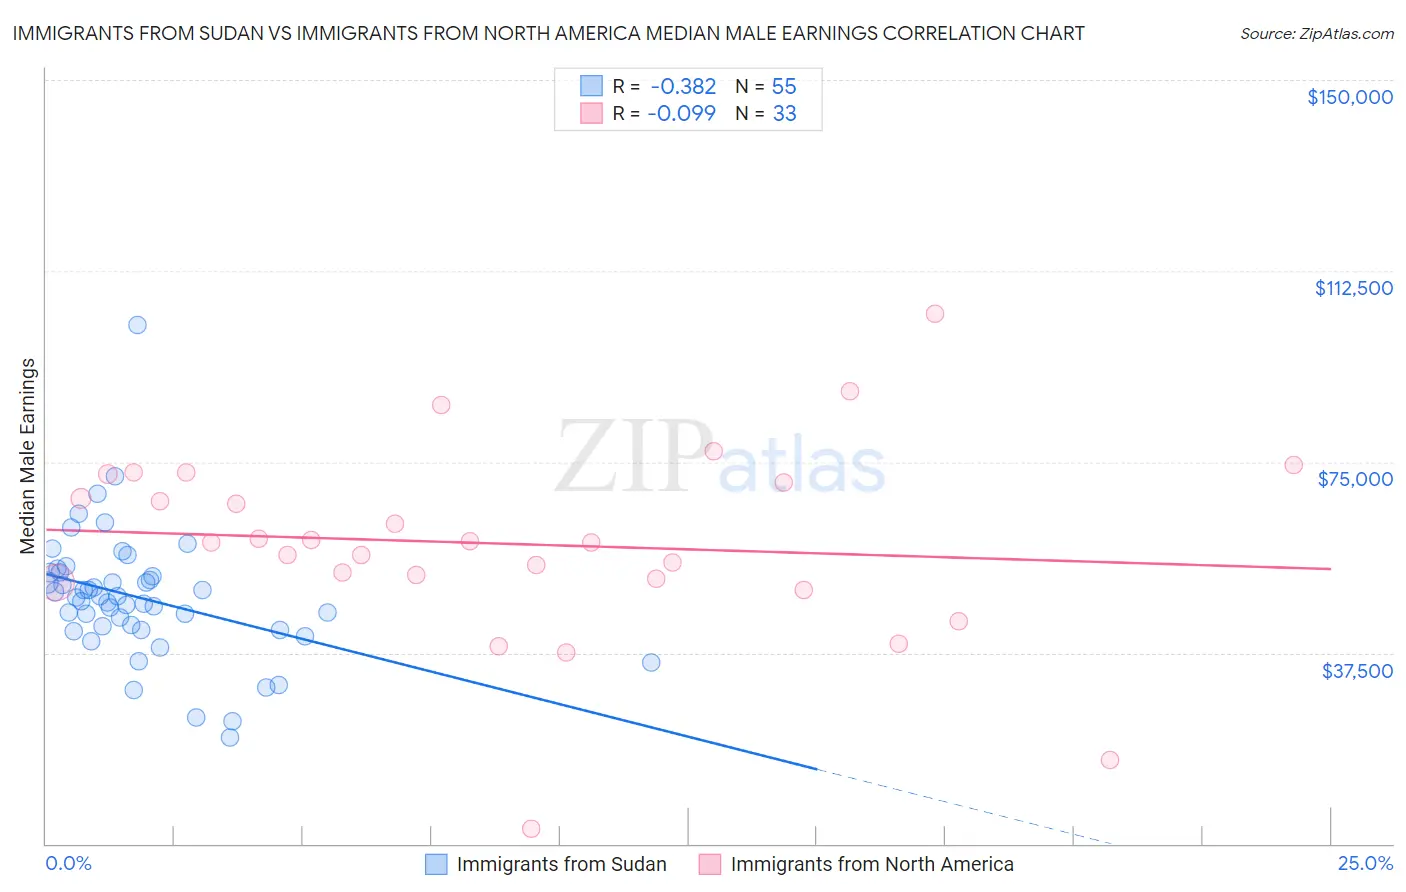
Immigrants from Sudan vs Immigrants from North America Median Male Earnings Correlation Chart
The statistical analysis conducted on geographies consisting of 118,955,444 people shows a mild negative correlation between the proportion of Immigrants from Sudan and median male earnings in the United States with a correlation coefficient (R) of -0.382 and weighted average of $51,489. Similarly, the statistical analysis conducted on geographies consisting of 462,182,608 people shows a slight negative correlation between the proportion of Immigrants from North America and median male earnings in the United States with a correlation coefficient (R) of -0.099 and weighted average of $60,265, a difference of 17.0%.
Median Male Earnings Correlation Summary
| Measurement | Immigrants from Sudan | Immigrants from North America |
| Minimum | $20,893 | $2,875 |
| Maximum | $101,789 | $104,091 |
| Range | $80,896 | $101,216 |
| Mean | $48,264 | $58,890 |
| Median | $48,306 | $59,220 |
| Interquartile 25% (IQ1) | $42,060 | $51,688 |
| Interquartile 75% (IQ3) | $53,241 | $71,762 |
| Interquartile Range (IQR) | $11,181 | $20,074 |
| Standard Deviation (Sample) | $12,693 | $19,290 |
| Standard Deviation (Population) | $12,577 | $18,995 |
Similar Demographics by Median Male Earnings
Demographics Similar to Immigrants from Sudan by Median Male Earnings
In terms of median male earnings, the demographic groups most similar to Immigrants from Sudan are Japanese ($51,473, a difference of 0.030%), Trinidadian and Tobagonian ($51,446, a difference of 0.080%), Samoan ($51,389, a difference of 0.19%), Immigrants from Cambodia ($51,594, a difference of 0.20%), and Ecuadorian ($51,596, a difference of 0.21%).
| Demographics | Rating | Rank | Median Male Earnings |
| Immigrants | Panama | 7.7 /100 | #218 | Tragic $51,962 |
| Immigrants | Ghana | 6.9 /100 | #219 | Tragic $51,836 |
| Immigrants | Armenia | 6.6 /100 | #220 | Tragic $51,793 |
| Immigrants | Senegal | 5.8 /100 | #221 | Tragic $51,647 |
| Immigrants | Bangladesh | 5.8 /100 | #222 | Tragic $51,642 |
| Ecuadorians | 5.5 /100 | #223 | Tragic $51,596 |
| Immigrants | Cambodia | 5.5 /100 | #224 | Tragic $51,594 |
| Immigrants | Sudan | 5.0 /100 | #225 | Tragic $51,489 |
| Japanese | 4.9 /100 | #226 | Tragic $51,473 |
| Trinidadians and Tobagonians | 4.8 /100 | #227 | Tragic $51,446 |
| Samoans | 4.6 /100 | #228 | Tragic $51,389 |
| Immigrants | Trinidad and Tobago | 4.5 /100 | #229 | Tragic $51,376 |
| Immigrants | Nigeria | 4.2 /100 | #230 | Tragic $51,310 |
| Barbadians | 3.9 /100 | #231 | Tragic $51,236 |
| Sudanese | 3.9 /100 | #232 | Tragic $51,216 |
Demographics Similar to Immigrants from North America by Median Male Earnings
In terms of median male earnings, the demographic groups most similar to Immigrants from North America are Immigrants from Western Europe ($60,334, a difference of 0.12%), Mongolian ($60,350, a difference of 0.14%), Immigrants from Bulgaria ($60,358, a difference of 0.16%), Immigrants from Canada ($60,388, a difference of 0.20%), and Argentinean ($60,117, a difference of 0.25%).
| Demographics | Rating | Rank | Median Male Earnings |
| Immigrants | Croatia | 99.8 /100 | #66 | Exceptional $60,914 |
| Immigrants | Spain | 99.8 /100 | #67 | Exceptional $60,750 |
| Immigrants | Serbia | 99.7 /100 | #68 | Exceptional $60,600 |
| Immigrants | Canada | 99.7 /100 | #69 | Exceptional $60,388 |
| Immigrants | Bulgaria | 99.7 /100 | #70 | Exceptional $60,358 |
| Mongolians | 99.7 /100 | #71 | Exceptional $60,350 |
| Immigrants | Western Europe | 99.7 /100 | #72 | Exceptional $60,334 |
| Immigrants | North America | 99.7 /100 | #73 | Exceptional $60,265 |
| Argentineans | 99.6 /100 | #74 | Exceptional $60,117 |
| Immigrants | Bolivia | 99.6 /100 | #75 | Exceptional $60,088 |
| Romanians | 99.6 /100 | #76 | Exceptional $60,063 |
| Paraguayans | 99.5 /100 | #77 | Exceptional $59,975 |
| Immigrants | Egypt | 99.5 /100 | #78 | Exceptional $59,925 |
| Immigrants | Ukraine | 99.5 /100 | #79 | Exceptional $59,820 |
| Immigrants | Hungary | 99.5 /100 | #80 | Exceptional $59,806 |