Greek vs British West Indian Professional Degree
COMPARE
Greek
British West Indian
Professional Degree
Professional Degree Comparison
Greeks
British West Indians
5.3%
PROFESSIONAL DEGREE
99.6/ 100
METRIC RATING
86th/ 347
METRIC RANK
3.8%
PROFESSIONAL DEGREE
2.4/ 100
METRIC RATING
239th/ 347
METRIC RANK
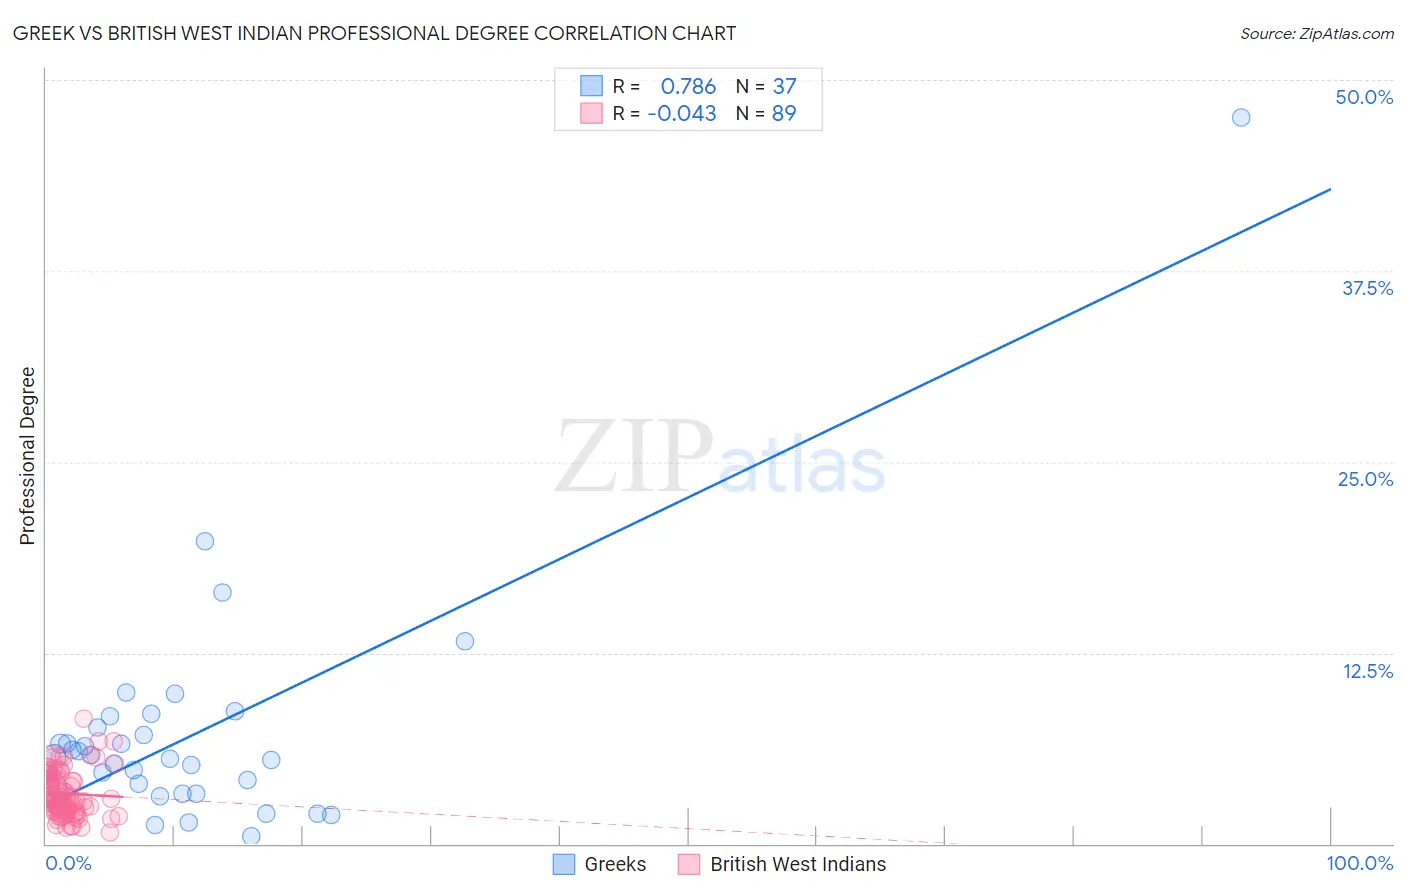
Greek vs British West Indian Professional Degree Correlation Chart
The statistical analysis conducted on geographies consisting of 480,768,816 people shows a strong positive correlation between the proportion of Greeks and percentage of population with at least professional degree education in the United States with a correlation coefficient (R) of 0.786 and weighted average of 5.3%. Similarly, the statistical analysis conducted on geographies consisting of 152,575,254 people shows no correlation between the proportion of British West Indians and percentage of population with at least professional degree education in the United States with a correlation coefficient (R) of -0.043 and weighted average of 3.8%, a difference of 38.2%.
Professional Degree Correlation Summary
| Measurement | Greek | British West Indian |
| Minimum | 0.52% | 0.74% |
| Maximum | 47.6% | 8.2% |
| Range | 47.0% | 7.4% |
| Mean | 7.2% | 3.3% |
| Median | 5.7% | 2.9% |
| Interquartile 25% (IQ1) | 3.4% | 2.1% |
| Interquartile 75% (IQ3) | 8.0% | 4.5% |
| Interquartile Range (IQR) | 4.6% | 2.3% |
| Standard Deviation (Sample) | 7.9% | 1.5% |
| Standard Deviation (Population) | 7.8% | 1.5% |
Similar Demographics by Professional Degree
Demographics Similar to Greeks by Professional Degree
In terms of professional degree, the demographic groups most similar to Greeks are Immigrants from Zimbabwe (5.3%, a difference of 0.0%), Carpatho Rusyn (5.3%, a difference of 0.020%), Immigrants from Croatia (5.3%, a difference of 0.020%), Immigrants from Chile (5.3%, a difference of 0.11%), and Romanian (5.3%, a difference of 0.23%).
| Demographics | Rating | Rank | Professional Degree |
| Immigrants | North America | 99.7 /100 | #79 | Exceptional 5.3% |
| Immigrants | England | 99.6 /100 | #80 | Exceptional 5.3% |
| Immigrants | Brazil | 99.6 /100 | #81 | Exceptional 5.3% |
| Romanians | 99.6 /100 | #82 | Exceptional 5.3% |
| Carpatho Rusyns | 99.6 /100 | #83 | Exceptional 5.3% |
| Immigrants | Croatia | 99.6 /100 | #84 | Exceptional 5.3% |
| Immigrants | Zimbabwe | 99.6 /100 | #85 | Exceptional 5.3% |
| Greeks | 99.6 /100 | #86 | Exceptional 5.3% |
| Immigrants | Chile | 99.5 /100 | #87 | Exceptional 5.3% |
| Egyptians | 99.5 /100 | #88 | Exceptional 5.3% |
| Chileans | 99.5 /100 | #89 | Exceptional 5.3% |
| Immigrants | Scotland | 99.5 /100 | #90 | Exceptional 5.3% |
| Laotians | 99.5 /100 | #91 | Exceptional 5.2% |
| Immigrants | Eastern Europe | 99.5 /100 | #92 | Exceptional 5.2% |
| Northern Europeans | 99.3 /100 | #93 | Exceptional 5.2% |
Demographics Similar to British West Indians by Professional Degree
In terms of professional degree, the demographic groups most similar to British West Indians are Immigrants from Ecuador (3.8%, a difference of 0.23%), Alaskan Athabascan (3.8%, a difference of 0.25%), Native Hawaiian (3.8%, a difference of 0.25%), Guamanian/Chamorro (3.8%, a difference of 0.33%), and Colville (3.8%, a difference of 0.39%).
| Demographics | Rating | Rank | Professional Degree |
| Cree | 4.3 /100 | #232 | Tragic 3.9% |
| Immigrants | Philippines | 4.1 /100 | #233 | Tragic 3.9% |
| Immigrants | Nonimmigrants | 4.0 /100 | #234 | Tragic 3.9% |
| Immigrants | Barbados | 4.0 /100 | #235 | Tragic 3.9% |
| Spanish Americans | 3.8 /100 | #236 | Tragic 3.9% |
| Immigrants | Trinidad and Tobago | 3.8 /100 | #237 | Tragic 3.9% |
| Colville | 2.6 /100 | #238 | Tragic 3.8% |
| British West Indians | 2.4 /100 | #239 | Tragic 3.8% |
| Immigrants | Ecuador | 2.3 /100 | #240 | Tragic 3.8% |
| Alaskan Athabascans | 2.3 /100 | #241 | Tragic 3.8% |
| Native Hawaiians | 2.3 /100 | #242 | Tragic 3.8% |
| Guamanians/Chamorros | 2.2 /100 | #243 | Tragic 3.8% |
| Immigrants | Bahamas | 2.0 /100 | #244 | Tragic 3.8% |
| French American Indians | 1.7 /100 | #245 | Tragic 3.8% |
| Marshallese | 1.7 /100 | #246 | Tragic 3.8% |