Greek vs Immigrants from El Salvador Median Family Income
COMPARE
Greek
Immigrants from El Salvador
Median Family Income
Median Family Income Comparison
Greeks
Immigrants from El Salvador
$115,192
MEDIAN FAMILY INCOME
99.8/ 100
METRIC RATING
57th/ 347
METRIC RANK
$92,545
MEDIAN FAMILY INCOME
0.6/ 100
METRIC RATING
252nd/ 347
METRIC RANK
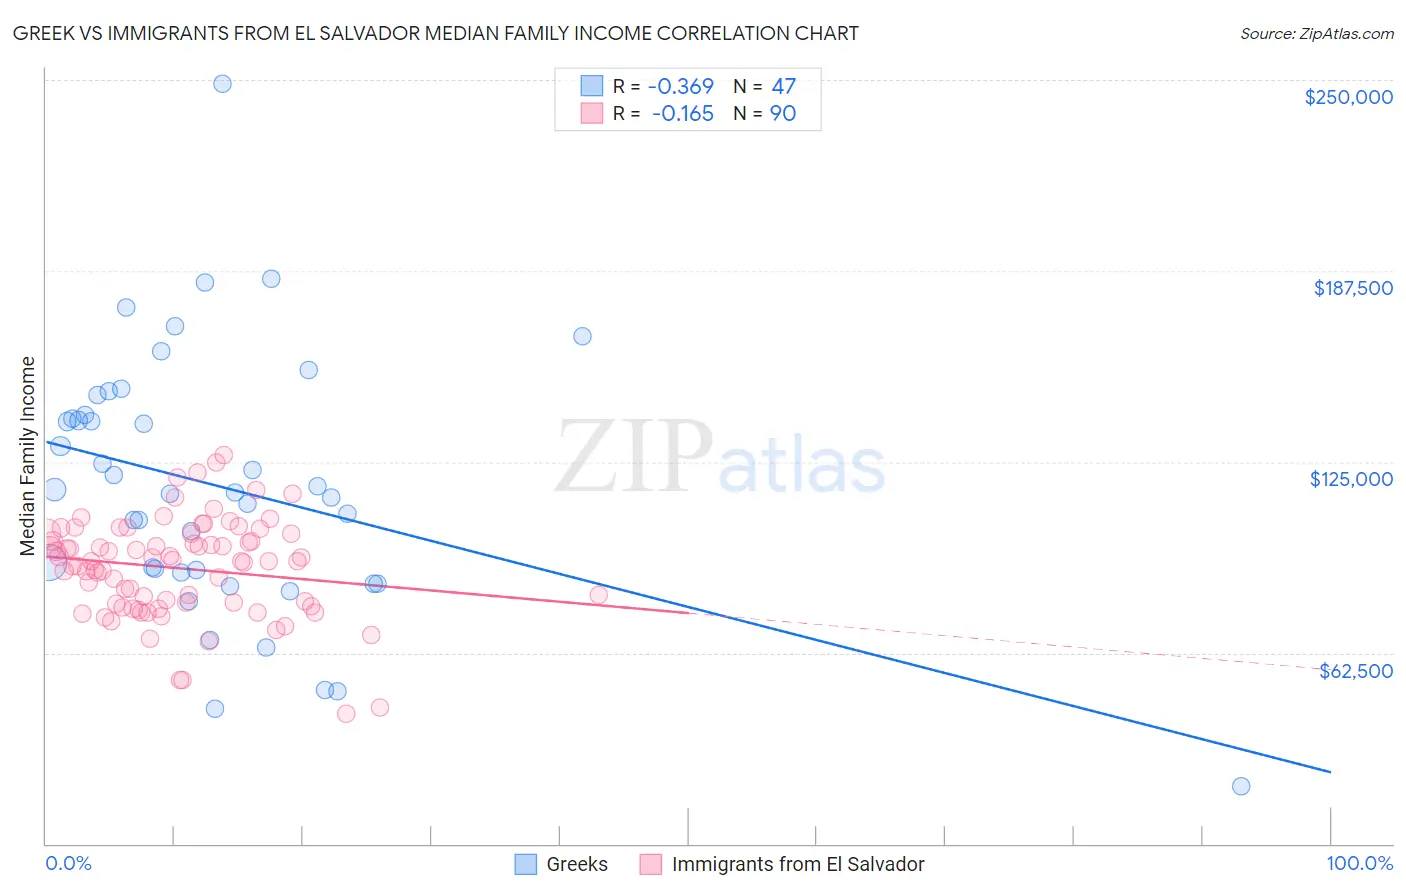
Greek vs Immigrants from El Salvador Median Family Income Correlation Chart
The statistical analysis conducted on geographies consisting of 482,131,670 people shows a mild negative correlation between the proportion of Greeks and median family income in the United States with a correlation coefficient (R) of -0.369 and weighted average of $115,192. Similarly, the statistical analysis conducted on geographies consisting of 357,645,519 people shows a poor negative correlation between the proportion of Immigrants from El Salvador and median family income in the United States with a correlation coefficient (R) of -0.165 and weighted average of $92,545, a difference of 24.5%.
Median Family Income Correlation Summary
| Measurement | Greek | Immigrants from El Salvador |
| Minimum | $18,825 | $42,420 |
| Maximum | $248,750 | $127,446 |
| Range | $229,925 | $85,026 |
| Mean | $116,811 | $90,153 |
| Median | $115,024 | $92,338 |
| Interquartile 25% (IQ1) | $88,890 | $78,680 |
| Interquartile 75% (IQ3) | $140,272 | $101,462 |
| Interquartile Range (IQR) | $51,382 | $22,782 |
| Standard Deviation (Sample) | $42,578 | $16,234 |
| Standard Deviation (Population) | $42,122 | $16,143 |
Similar Demographics by Median Family Income
Demographics Similar to Greeks by Median Family Income
In terms of median family income, the demographic groups most similar to Greeks are New Zealander ($115,230, a difference of 0.030%), Immigrants from Indonesia ($115,162, a difference of 0.030%), Lithuanian ($115,395, a difference of 0.18%), Immigrants from Netherlands ($114,987, a difference of 0.18%), and Immigrants from Europe ($115,523, a difference of 0.29%).
| Demographics | Rating | Rank | Median Family Income |
| Immigrants | Czechoslovakia | 99.9 /100 | #50 | Exceptional $116,165 |
| Immigrants | Malaysia | 99.9 /100 | #51 | Exceptional $115,880 |
| Maltese | 99.9 /100 | #52 | Exceptional $115,862 |
| Immigrants | Norway | 99.9 /100 | #53 | Exceptional $115,847 |
| Immigrants | Europe | 99.9 /100 | #54 | Exceptional $115,523 |
| Lithuanians | 99.8 /100 | #55 | Exceptional $115,395 |
| New Zealanders | 99.8 /100 | #56 | Exceptional $115,230 |
| Greeks | 99.8 /100 | #57 | Exceptional $115,192 |
| Immigrants | Indonesia | 99.8 /100 | #58 | Exceptional $115,162 |
| Immigrants | Netherlands | 99.8 /100 | #59 | Exceptional $114,987 |
| Immigrants | Latvia | 99.8 /100 | #60 | Exceptional $114,826 |
| Immigrants | Belarus | 99.8 /100 | #61 | Exceptional $114,586 |
| Mongolians | 99.8 /100 | #62 | Exceptional $114,553 |
| Immigrants | Pakistan | 99.8 /100 | #63 | Exceptional $114,406 |
| Immigrants | Scotland | 99.7 /100 | #64 | Exceptional $114,392 |
Demographics Similar to Immigrants from El Salvador by Median Family Income
In terms of median family income, the demographic groups most similar to Immigrants from El Salvador are Immigrants from Guyana ($92,513, a difference of 0.030%), Immigrants from Somalia ($92,609, a difference of 0.070%), Immigrants from Barbados ($92,419, a difference of 0.14%), West Indian ($92,765, a difference of 0.24%), and Immigrants from Ecuador ($92,837, a difference of 0.32%).
| Demographics | Rating | Rank | Median Family Income |
| Immigrants | Middle Africa | 1.0 /100 | #245 | Tragic $93,593 |
| Guyanese | 0.9 /100 | #246 | Tragic $93,373 |
| Immigrants | Senegal | 0.7 /100 | #247 | Tragic $92,912 |
| French American Indians | 0.7 /100 | #248 | Tragic $92,872 |
| Immigrants | Ecuador | 0.7 /100 | #249 | Tragic $92,837 |
| West Indians | 0.6 /100 | #250 | Tragic $92,765 |
| Immigrants | Somalia | 0.6 /100 | #251 | Tragic $92,609 |
| Immigrants | El Salvador | 0.6 /100 | #252 | Tragic $92,545 |
| Immigrants | Guyana | 0.6 /100 | #253 | Tragic $92,513 |
| Immigrants | Barbados | 0.5 /100 | #254 | Tragic $92,419 |
| Immigrants | Laos | 0.5 /100 | #255 | Tragic $92,239 |
| Nicaraguans | 0.5 /100 | #256 | Tragic $92,231 |
| Americans | 0.4 /100 | #257 | Tragic $92,096 |
| Osage | 0.4 /100 | #258 | Tragic $91,926 |
| Cape Verdeans | 0.4 /100 | #259 | Tragic $91,848 |