Hmong vs Serbian Median Female Earnings
COMPARE
Hmong
Serbian
Median Female Earnings
Median Female Earnings Comparison
Hmong
Serbians
$35,498
MEDIAN FEMALE EARNINGS
0.0/ 100
METRIC RATING
297th/ 347
METRIC RANK
$40,539
MEDIAN FEMALE EARNINGS
85.2/ 100
METRIC RATING
140th/ 347
METRIC RANK
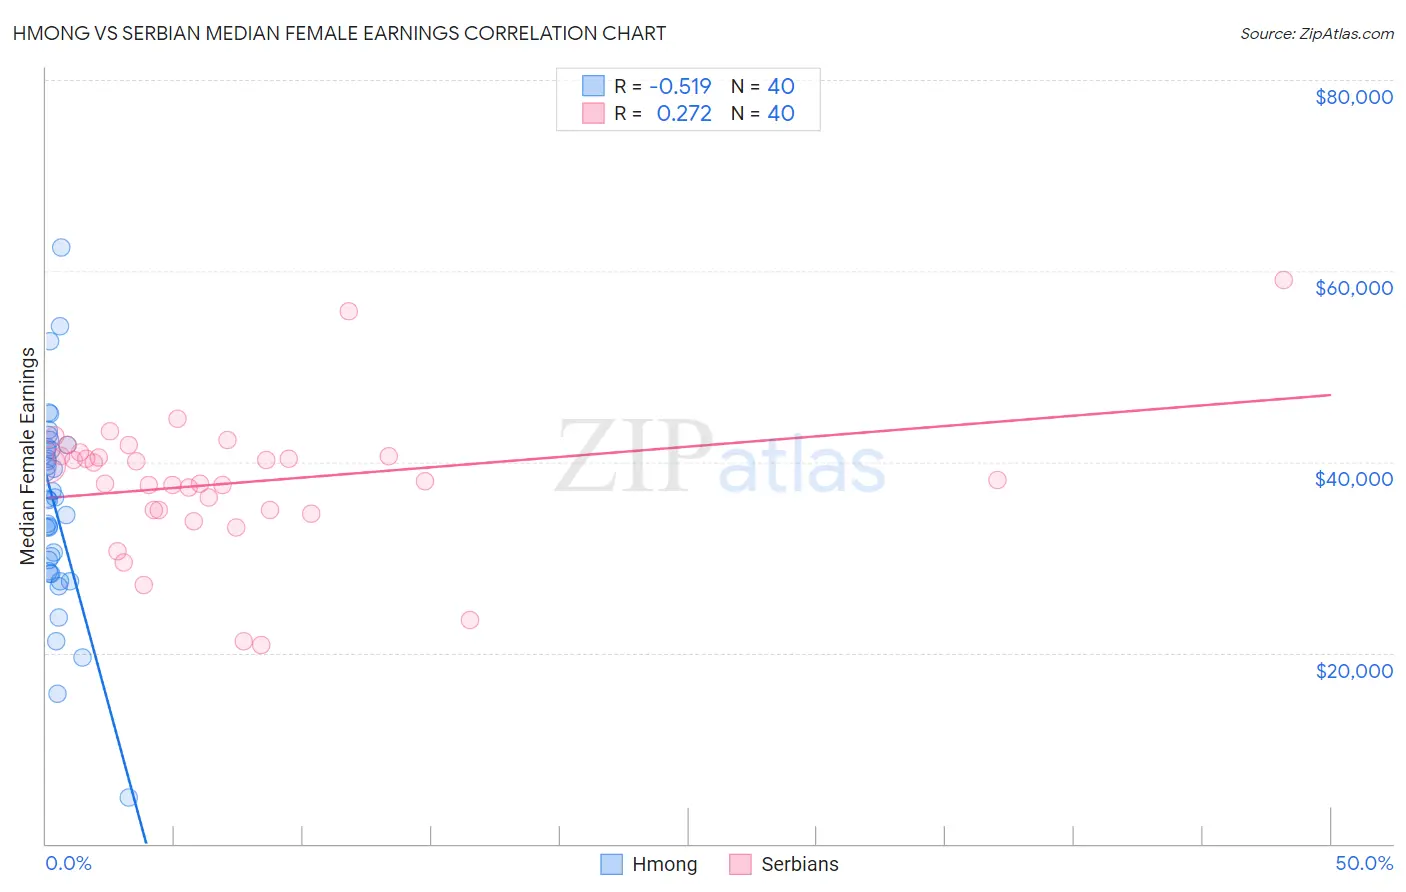
Hmong vs Serbian Median Female Earnings Correlation Chart
The statistical analysis conducted on geographies consisting of 24,681,537 people shows a substantial negative correlation between the proportion of Hmong and median female earnings in the United States with a correlation coefficient (R) of -0.519 and weighted average of $35,498. Similarly, the statistical analysis conducted on geographies consisting of 267,582,893 people shows a weak positive correlation between the proportion of Serbians and median female earnings in the United States with a correlation coefficient (R) of 0.272 and weighted average of $40,539, a difference of 14.2%.
Median Female Earnings Correlation Summary
| Measurement | Hmong | Serbian |
| Minimum | $4,844 | $20,870 |
| Maximum | $62,438 | $59,044 |
| Range | $57,594 | $38,174 |
| Mean | $35,172 | $37,788 |
| Median | $36,091 | $38,020 |
| Interquartile 25% (IQ1) | $28,415 | $34,950 |
| Interquartile 75% (IQ3) | $41,366 | $40,620 |
| Interquartile Range (IQR) | $12,951 | $5,670 |
| Standard Deviation (Sample) | $10,537 | $7,286 |
| Standard Deviation (Population) | $10,404 | $7,194 |
Similar Demographics by Median Female Earnings
Demographics Similar to Hmong by Median Female Earnings
In terms of median female earnings, the demographic groups most similar to Hmong are Immigrants from Micronesia ($35,477, a difference of 0.060%), Immigrants from Guatemala ($35,444, a difference of 0.15%), Yuman ($35,377, a difference of 0.34%), Mexican American Indian ($35,629, a difference of 0.37%), and Comanche ($35,661, a difference of 0.46%).
| Demographics | Rating | Rank | Median Female Earnings |
| Central American Indians | 0.0 /100 | #290 | Tragic $35,930 |
| Blackfeet | 0.0 /100 | #291 | Tragic $35,864 |
| Americans | 0.0 /100 | #292 | Tragic $35,777 |
| Guatemalans | 0.0 /100 | #293 | Tragic $35,695 |
| Cheyenne | 0.0 /100 | #294 | Tragic $35,673 |
| Comanche | 0.0 /100 | #295 | Tragic $35,661 |
| Mexican American Indians | 0.0 /100 | #296 | Tragic $35,629 |
| Hmong | 0.0 /100 | #297 | Tragic $35,498 |
| Immigrants | Micronesia | 0.0 /100 | #298 | Tragic $35,477 |
| Immigrants | Guatemala | 0.0 /100 | #299 | Tragic $35,444 |
| Yuman | 0.0 /100 | #300 | Tragic $35,377 |
| Pima | 0.0 /100 | #301 | Tragic $35,326 |
| Blacks/African Americans | 0.0 /100 | #302 | Tragic $35,315 |
| Immigrants | Latin America | 0.0 /100 | #303 | Tragic $35,307 |
| Crow | 0.0 /100 | #304 | Tragic $35,266 |
Demographics Similar to Serbians by Median Female Earnings
In terms of median female earnings, the demographic groups most similar to Serbians are Immigrants from South Eastern Asia ($40,558, a difference of 0.050%), Taiwanese ($40,576, a difference of 0.090%), Immigrants from Syria ($40,499, a difference of 0.10%), Sri Lankan ($40,496, a difference of 0.10%), and Northern European ($40,491, a difference of 0.12%).
| Demographics | Rating | Rank | Median Female Earnings |
| Syrians | 89.5 /100 | #133 | Excellent $40,727 |
| Arabs | 89.3 /100 | #134 | Excellent $40,718 |
| Immigrants | Nepal | 89.0 /100 | #135 | Excellent $40,704 |
| Immigrants | Eastern Africa | 87.7 /100 | #136 | Excellent $40,644 |
| Pakistanis | 86.6 /100 | #137 | Excellent $40,596 |
| Taiwanese | 86.1 /100 | #138 | Excellent $40,576 |
| Immigrants | South Eastern Asia | 85.7 /100 | #139 | Excellent $40,558 |
| Serbians | 85.2 /100 | #140 | Excellent $40,539 |
| Immigrants | Syria | 84.1 /100 | #141 | Excellent $40,499 |
| Sri Lankans | 84.0 /100 | #142 | Excellent $40,496 |
| Northern Europeans | 83.9 /100 | #143 | Excellent $40,491 |
| Immigrants | North Macedonia | 83.8 /100 | #144 | Excellent $40,488 |
| Brazilians | 83.6 /100 | #145 | Excellent $40,483 |
| Ghanaians | 82.1 /100 | #146 | Excellent $40,429 |
| Vietnamese | 80.4 /100 | #147 | Excellent $40,377 |