Native Hawaiian vs Serbian Median Female Earnings
COMPARE
Native Hawaiian
Serbian
Median Female Earnings
Median Female Earnings Comparison
Native Hawaiians
Serbians
$38,461
MEDIAN FEMALE EARNINGS
7.1/ 100
METRIC RATING
224th/ 347
METRIC RANK
$40,539
MEDIAN FEMALE EARNINGS
85.2/ 100
METRIC RATING
140th/ 347
METRIC RANK
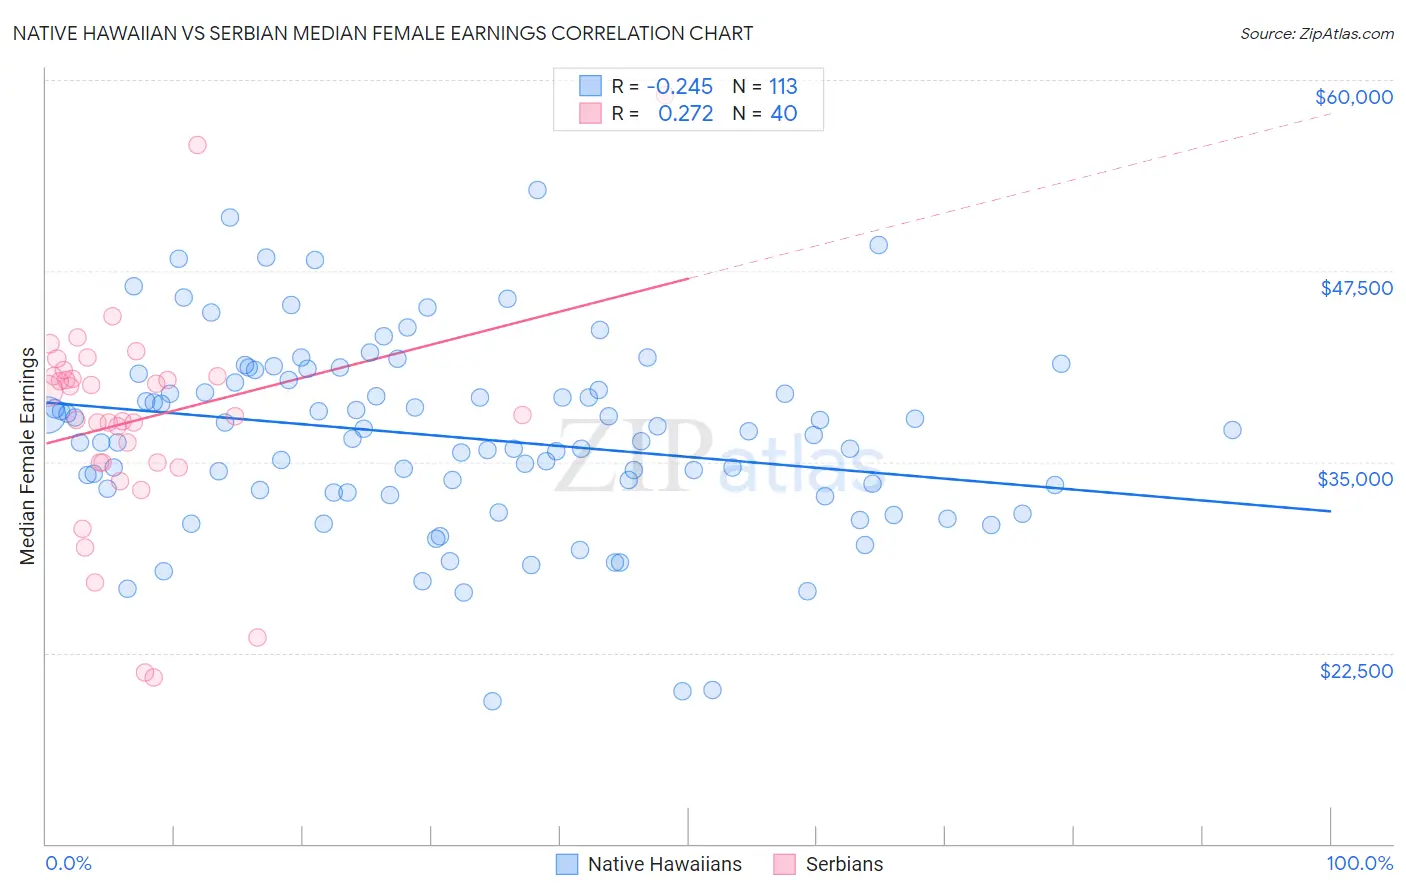
Native Hawaiian vs Serbian Median Female Earnings Correlation Chart
The statistical analysis conducted on geographies consisting of 331,982,938 people shows a weak negative correlation between the proportion of Native Hawaiians and median female earnings in the United States with a correlation coefficient (R) of -0.245 and weighted average of $38,461. Similarly, the statistical analysis conducted on geographies consisting of 267,582,893 people shows a weak positive correlation between the proportion of Serbians and median female earnings in the United States with a correlation coefficient (R) of 0.272 and weighted average of $40,539, a difference of 5.4%.
Median Female Earnings Correlation Summary
| Measurement | Native Hawaiian | Serbian |
| Minimum | $19,330 | $20,870 |
| Maximum | $52,779 | $59,044 |
| Range | $33,449 | $38,174 |
| Mean | $36,634 | $37,788 |
| Median | $36,735 | $38,020 |
| Interquartile 25% (IQ1) | $33,052 | $34,950 |
| Interquartile 75% (IQ3) | $40,312 | $40,620 |
| Interquartile Range (IQR) | $7,259 | $5,670 |
| Standard Deviation (Sample) | $6,153 | $7,286 |
| Standard Deviation (Population) | $6,125 | $7,194 |
Similar Demographics by Median Female Earnings
Demographics Similar to Native Hawaiians by Median Female Earnings
In terms of median female earnings, the demographic groups most similar to Native Hawaiians are French ($38,457, a difference of 0.010%), French Canadian ($38,436, a difference of 0.060%), Immigrants from Sudan ($38,511, a difference of 0.13%), Japanese ($38,528, a difference of 0.17%), and Scottish ($38,397, a difference of 0.17%).
| Demographics | Rating | Rank | Median Female Earnings |
| Immigrants | Jamaica | 9.7 /100 | #217 | Tragic $38,625 |
| Cape Verdeans | 9.5 /100 | #218 | Tragic $38,614 |
| Nepalese | 9.3 /100 | #219 | Tragic $38,603 |
| Yugoslavians | 8.8 /100 | #220 | Tragic $38,573 |
| Immigrants | Azores | 8.8 /100 | #221 | Tragic $38,573 |
| Japanese | 8.1 /100 | #222 | Tragic $38,528 |
| Immigrants | Sudan | 7.8 /100 | #223 | Tragic $38,511 |
| Native Hawaiians | 7.1 /100 | #224 | Tragic $38,461 |
| French | 7.0 /100 | #225 | Tragic $38,457 |
| French Canadians | 6.8 /100 | #226 | Tragic $38,436 |
| Scottish | 6.3 /100 | #227 | Tragic $38,397 |
| Sub-Saharan Africans | 6.2 /100 | #228 | Tragic $38,391 |
| Belgians | 6.1 /100 | #229 | Tragic $38,382 |
| Basques | 5.7 /100 | #230 | Tragic $38,352 |
| Somalis | 5.5 /100 | #231 | Tragic $38,333 |
Demographics Similar to Serbians by Median Female Earnings
In terms of median female earnings, the demographic groups most similar to Serbians are Immigrants from South Eastern Asia ($40,558, a difference of 0.050%), Taiwanese ($40,576, a difference of 0.090%), Immigrants from Syria ($40,499, a difference of 0.10%), Sri Lankan ($40,496, a difference of 0.10%), and Northern European ($40,491, a difference of 0.12%).
| Demographics | Rating | Rank | Median Female Earnings |
| Syrians | 89.5 /100 | #133 | Excellent $40,727 |
| Arabs | 89.3 /100 | #134 | Excellent $40,718 |
| Immigrants | Nepal | 89.0 /100 | #135 | Excellent $40,704 |
| Immigrants | Eastern Africa | 87.7 /100 | #136 | Excellent $40,644 |
| Pakistanis | 86.6 /100 | #137 | Excellent $40,596 |
| Taiwanese | 86.1 /100 | #138 | Excellent $40,576 |
| Immigrants | South Eastern Asia | 85.7 /100 | #139 | Excellent $40,558 |
| Serbians | 85.2 /100 | #140 | Excellent $40,539 |
| Immigrants | Syria | 84.1 /100 | #141 | Excellent $40,499 |
| Sri Lankans | 84.0 /100 | #142 | Excellent $40,496 |
| Northern Europeans | 83.9 /100 | #143 | Excellent $40,491 |
| Immigrants | North Macedonia | 83.8 /100 | #144 | Excellent $40,488 |
| Brazilians | 83.6 /100 | #145 | Excellent $40,483 |
| Ghanaians | 82.1 /100 | #146 | Excellent $40,429 |
| Vietnamese | 80.4 /100 | #147 | Excellent $40,377 |