Ghanaian vs Serbian Hearing Disability
COMPARE
Ghanaian
Serbian
Hearing Disability
Hearing Disability Comparison
Ghanaians
Serbians
2.5%
HEARING DISABILITY
99.8/ 100
METRIC RATING
21st/ 347
METRIC RANK
3.3%
HEARING DISABILITY
2.2/ 100
METRIC RATING
236th/ 347
METRIC RANK
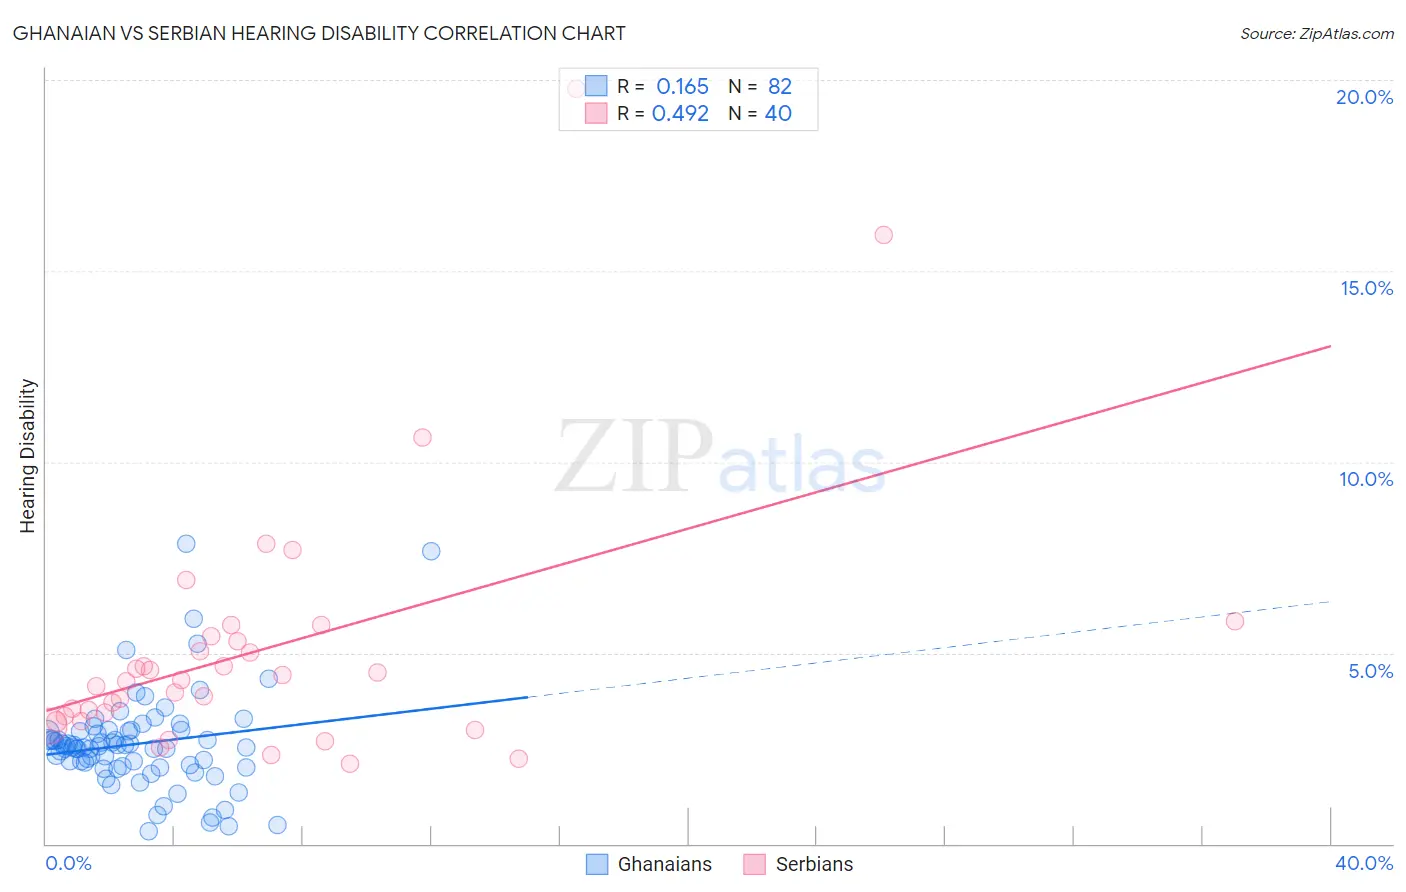
Ghanaian vs Serbian Hearing Disability Correlation Chart
The statistical analysis conducted on geographies consisting of 190,612,767 people shows a poor positive correlation between the proportion of Ghanaians and percentage of population with hearing disability in the United States with a correlation coefficient (R) of 0.165 and weighted average of 2.5%. Similarly, the statistical analysis conducted on geographies consisting of 267,622,098 people shows a moderate positive correlation between the proportion of Serbians and percentage of population with hearing disability in the United States with a correlation coefficient (R) of 0.492 and weighted average of 3.3%, a difference of 28.0%.
Hearing Disability Correlation Summary
| Measurement | Ghanaian | Serbian |
| Minimum | 0.32% | 2.1% |
| Maximum | 7.9% | 19.8% |
| Range | 7.5% | 17.7% |
| Mean | 2.6% | 5.1% |
| Median | 2.5% | 4.3% |
| Interquartile 25% (IQ1) | 2.0% | 3.3% |
| Interquartile 75% (IQ3) | 3.0% | 5.4% |
| Interquartile Range (IQR) | 0.92% | 2.1% |
| Standard Deviation (Sample) | 1.3% | 3.4% |
| Standard Deviation (Population) | 1.3% | 3.4% |
Similar Demographics by Hearing Disability
Demographics Similar to Ghanaians by Hearing Disability
In terms of hearing disability, the demographic groups most similar to Ghanaians are Immigrants from Sierra Leone (2.6%, a difference of 0.040%), Immigrants from Bolivia (2.5%, a difference of 0.070%), Thai (2.5%, a difference of 0.11%), Dominican (2.5%, a difference of 0.14%), and Immigrants from Nigeria (2.6%, a difference of 0.54%).
| Demographics | Rating | Rank | Hearing Disability |
| Ecuadorians | 99.9 /100 | #14 | Exceptional 2.5% |
| Barbadians | 99.9 /100 | #15 | Exceptional 2.5% |
| Immigrants | West Indies | 99.9 /100 | #16 | Exceptional 2.5% |
| Immigrants | India | 99.9 /100 | #17 | Exceptional 2.5% |
| Dominicans | 99.8 /100 | #18 | Exceptional 2.5% |
| Thais | 99.8 /100 | #19 | Exceptional 2.5% |
| Immigrants | Bolivia | 99.8 /100 | #20 | Exceptional 2.5% |
| Ghanaians | 99.8 /100 | #21 | Exceptional 2.5% |
| Immigrants | Sierra Leone | 99.8 /100 | #22 | Exceptional 2.6% |
| Immigrants | Nigeria | 99.8 /100 | #23 | Exceptional 2.6% |
| Immigrants | Ghana | 99.8 /100 | #24 | Exceptional 2.6% |
| Immigrants | El Salvador | 99.7 /100 | #25 | Exceptional 2.6% |
| Immigrants | Senegal | 99.7 /100 | #26 | Exceptional 2.6% |
| Immigrants | South Central Asia | 99.7 /100 | #27 | Exceptional 2.6% |
| Immigrants | Haiti | 99.7 /100 | #28 | Exceptional 2.6% |
Demographics Similar to Serbians by Hearing Disability
In terms of hearing disability, the demographic groups most similar to Serbians are Guamanian/Chamorro (3.3%, a difference of 0.060%), Central American Indian (3.3%, a difference of 0.17%), Estonian (3.3%, a difference of 0.24%), Immigrants from Austria (3.3%, a difference of 0.39%), and German Russian (3.3%, a difference of 0.39%).
| Demographics | Rating | Rank | Hearing Disability |
| Maltese | 4.1 /100 | #229 | Tragic 3.2% |
| Greeks | 3.2 /100 | #230 | Tragic 3.2% |
| Luxembourgers | 2.9 /100 | #231 | Tragic 3.2% |
| Ukrainians | 2.9 /100 | #232 | Tragic 3.2% |
| Estonians | 2.4 /100 | #233 | Tragic 3.3% |
| Central American Indians | 2.3 /100 | #234 | Tragic 3.3% |
| Guamanians/Chamorros | 2.2 /100 | #235 | Tragic 3.3% |
| Serbians | 2.2 /100 | #236 | Tragic 3.3% |
| Immigrants | Austria | 1.8 /100 | #237 | Tragic 3.3% |
| German Russians | 1.8 /100 | #238 | Tragic 3.3% |
| Nepalese | 1.2 /100 | #239 | Tragic 3.3% |
| Immigrants | Netherlands | 1.1 /100 | #240 | Tragic 3.3% |
| Samoans | 1.1 /100 | #241 | Tragic 3.3% |
| Yugoslavians | 1.0 /100 | #242 | Tragic 3.3% |
| Immigrants | Western Europe | 1.0 /100 | #243 | Tragic 3.3% |