Immigrants from India vs Serbian Median Female Earnings
COMPARE
Immigrants from India
Serbian
Median Female Earnings
Median Female Earnings Comparison
Immigrants from India
Serbians
$48,292
MEDIAN FEMALE EARNINGS
100.0/ 100
METRIC RATING
4th/ 347
METRIC RANK
$40,539
MEDIAN FEMALE EARNINGS
85.2/ 100
METRIC RATING
140th/ 347
METRIC RANK
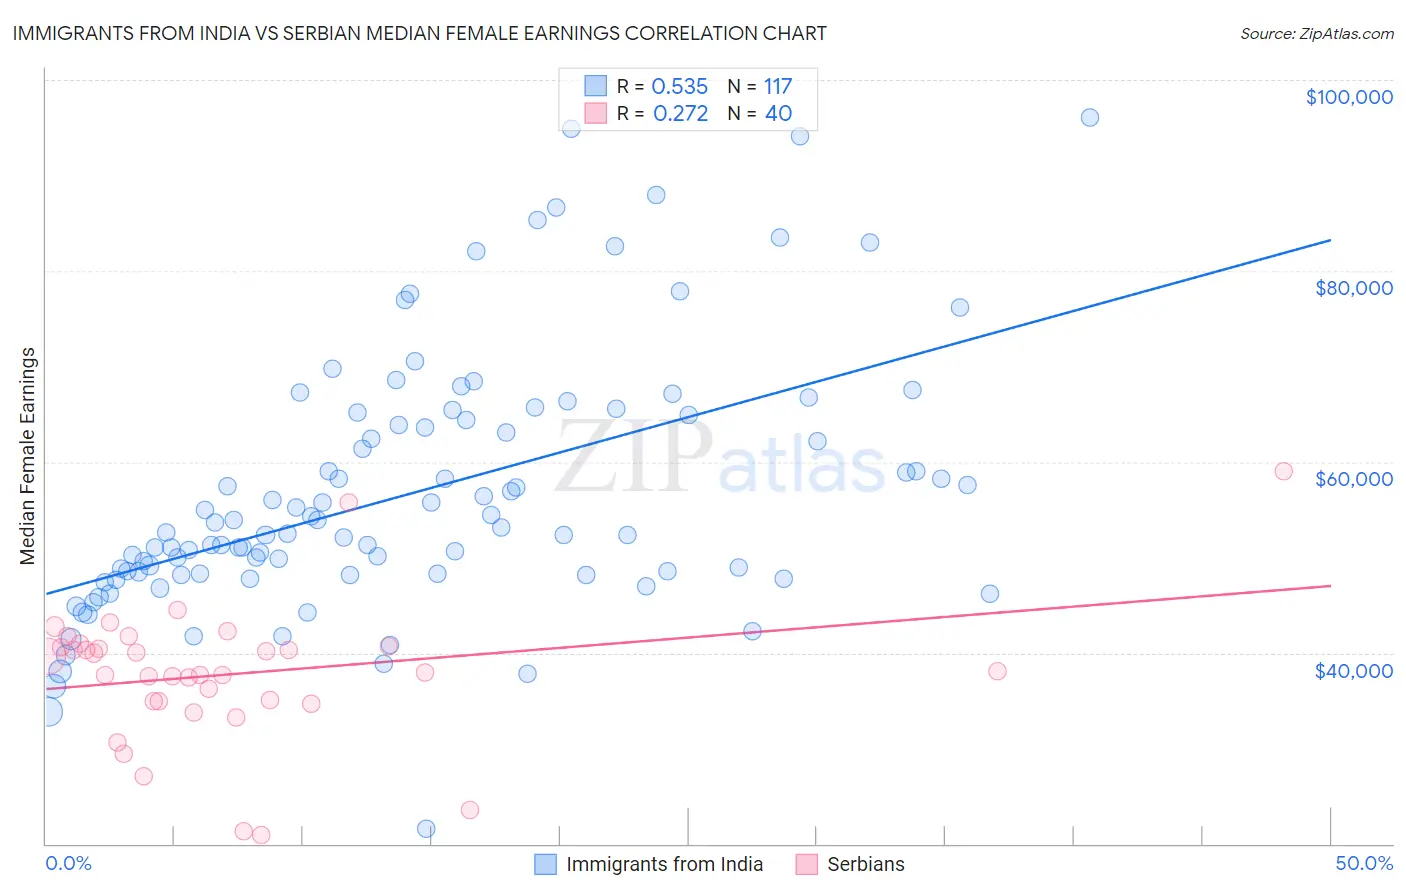
Immigrants from India vs Serbian Median Female Earnings Correlation Chart
The statistical analysis conducted on geographies consisting of 433,961,093 people shows a substantial positive correlation between the proportion of Immigrants from India and median female earnings in the United States with a correlation coefficient (R) of 0.535 and weighted average of $48,292. Similarly, the statistical analysis conducted on geographies consisting of 267,582,893 people shows a weak positive correlation between the proportion of Serbians and median female earnings in the United States with a correlation coefficient (R) of 0.272 and weighted average of $40,539, a difference of 19.1%.
Median Female Earnings Correlation Summary
| Measurement | Immigrants from India | Serbian |
| Minimum | $21,591 | $20,870 |
| Maximum | $96,063 | $59,044 |
| Range | $74,472 | $38,174 |
| Mean | $56,646 | $37,788 |
| Median | $52,549 | $38,020 |
| Interquartile 25% (IQ1) | $48,205 | $34,950 |
| Interquartile 75% (IQ3) | $64,667 | $40,620 |
| Interquartile Range (IQR) | $16,462 | $5,670 |
| Standard Deviation (Sample) | $13,523 | $7,286 |
| Standard Deviation (Population) | $13,465 | $7,194 |
Similar Demographics by Median Female Earnings
Demographics Similar to Immigrants from India by Median Female Earnings
In terms of median female earnings, the demographic groups most similar to Immigrants from India are Immigrants from Singapore ($47,986, a difference of 0.64%), Immigrants from Ireland ($47,598, a difference of 1.5%), Thai ($47,577, a difference of 1.5%), Iranian ($47,421, a difference of 1.8%), and Immigrants from Taiwan ($49,256, a difference of 2.0%).
| Demographics | Rating | Rank | Median Female Earnings |
| Immigrants | Hong Kong | 100.0 /100 | #1 | Exceptional $49,818 |
| Filipinos | 100.0 /100 | #2 | Exceptional $49,508 |
| Immigrants | Taiwan | 100.0 /100 | #3 | Exceptional $49,256 |
| Immigrants | India | 100.0 /100 | #4 | Exceptional $48,292 |
| Immigrants | Singapore | 100.0 /100 | #5 | Exceptional $47,986 |
| Immigrants | Ireland | 100.0 /100 | #6 | Exceptional $47,598 |
| Thais | 100.0 /100 | #7 | Exceptional $47,577 |
| Iranians | 100.0 /100 | #8 | Exceptional $47,421 |
| Immigrants | Iran | 100.0 /100 | #9 | Exceptional $47,154 |
| Immigrants | China | 100.0 /100 | #10 | Exceptional $46,972 |
| Okinawans | 100.0 /100 | #11 | Exceptional $46,905 |
| Immigrants | Israel | 100.0 /100 | #12 | Exceptional $46,902 |
| Immigrants | Australia | 100.0 /100 | #13 | Exceptional $46,573 |
| Soviet Union | 100.0 /100 | #14 | Exceptional $46,556 |
| Immigrants | Eastern Asia | 100.0 /100 | #15 | Exceptional $46,502 |
Demographics Similar to Serbians by Median Female Earnings
In terms of median female earnings, the demographic groups most similar to Serbians are Immigrants from South Eastern Asia ($40,558, a difference of 0.050%), Taiwanese ($40,576, a difference of 0.090%), Immigrants from Syria ($40,499, a difference of 0.10%), Sri Lankan ($40,496, a difference of 0.10%), and Northern European ($40,491, a difference of 0.12%).
| Demographics | Rating | Rank | Median Female Earnings |
| Syrians | 89.5 /100 | #133 | Excellent $40,727 |
| Arabs | 89.3 /100 | #134 | Excellent $40,718 |
| Immigrants | Nepal | 89.0 /100 | #135 | Excellent $40,704 |
| Immigrants | Eastern Africa | 87.7 /100 | #136 | Excellent $40,644 |
| Pakistanis | 86.6 /100 | #137 | Excellent $40,596 |
| Taiwanese | 86.1 /100 | #138 | Excellent $40,576 |
| Immigrants | South Eastern Asia | 85.7 /100 | #139 | Excellent $40,558 |
| Serbians | 85.2 /100 | #140 | Excellent $40,539 |
| Immigrants | Syria | 84.1 /100 | #141 | Excellent $40,499 |
| Sri Lankans | 84.0 /100 | #142 | Excellent $40,496 |
| Northern Europeans | 83.9 /100 | #143 | Excellent $40,491 |
| Immigrants | North Macedonia | 83.8 /100 | #144 | Excellent $40,488 |
| Brazilians | 83.6 /100 | #145 | Excellent $40,483 |
| Ghanaians | 82.1 /100 | #146 | Excellent $40,429 |
| Vietnamese | 80.4 /100 | #147 | Excellent $40,377 |