Ghanaian vs Immigrants from El Salvador Median Family Income
COMPARE
Ghanaian
Immigrants from El Salvador
Median Family Income
Median Family Income Comparison
Ghanaians
Immigrants from El Salvador
$98,877
MEDIAN FAMILY INCOME
12.6/ 100
METRIC RATING
204th/ 347
METRIC RANK
$92,545
MEDIAN FAMILY INCOME
0.6/ 100
METRIC RATING
252nd/ 347
METRIC RANK
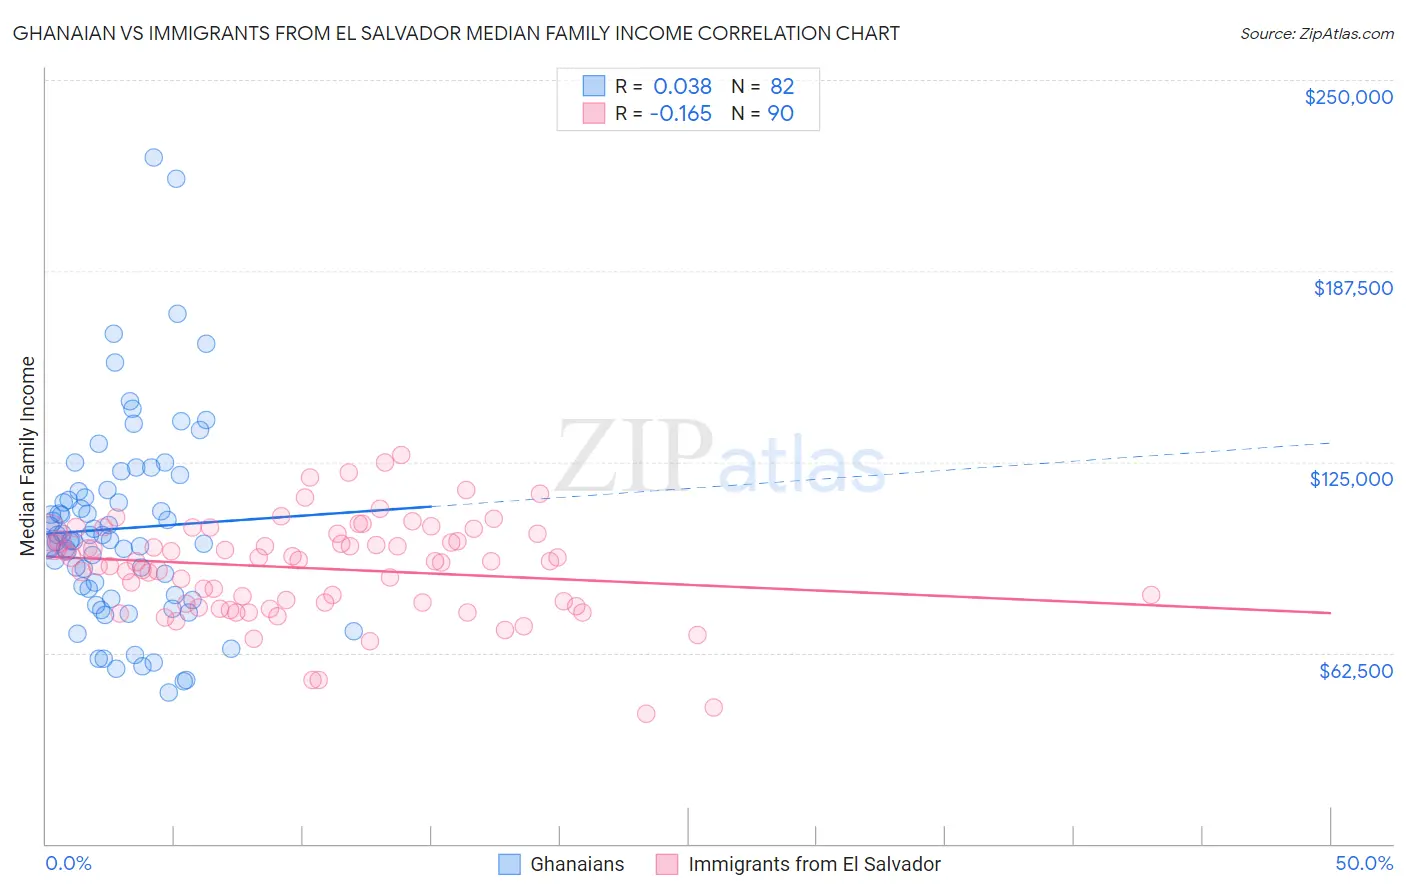
Ghanaian vs Immigrants from El Salvador Median Family Income Correlation Chart
The statistical analysis conducted on geographies consisting of 190,476,468 people shows no correlation between the proportion of Ghanaians and median family income in the United States with a correlation coefficient (R) of 0.038 and weighted average of $98,877. Similarly, the statistical analysis conducted on geographies consisting of 357,645,519 people shows a poor negative correlation between the proportion of Immigrants from El Salvador and median family income in the United States with a correlation coefficient (R) of -0.165 and weighted average of $92,545, a difference of 6.8%.
Median Family Income Correlation Summary
| Measurement | Ghanaian | Immigrants from El Salvador |
| Minimum | $49,625 | $42,420 |
| Maximum | $224,545 | $127,446 |
| Range | $174,920 | $85,026 |
| Mean | $103,158 | $90,153 |
| Median | $99,461 | $92,338 |
| Interquartile 25% (IQ1) | $81,320 | $78,680 |
| Interquartile 75% (IQ3) | $115,481 | $101,462 |
| Interquartile Range (IQR) | $34,161 | $22,782 |
| Standard Deviation (Sample) | $32,730 | $16,234 |
| Standard Deviation (Population) | $32,529 | $16,143 |
Similar Demographics by Median Family Income
Demographics Similar to Ghanaians by Median Family Income
In terms of median family income, the demographic groups most similar to Ghanaians are Hawaiian ($98,869, a difference of 0.010%), Immigrants from Iraq ($98,786, a difference of 0.090%), Aleut ($98,702, a difference of 0.18%), Immigrants from Uruguay ($98,205, a difference of 0.68%), and Scotch-Irish ($99,591, a difference of 0.72%).
| Demographics | Rating | Rank | Median Family Income |
| Immigrants | Cameroon | 22.8 /100 | #197 | Fair $100,289 |
| Immigrants | Africa | 22.5 /100 | #198 | Fair $100,256 |
| Yugoslavians | 21.3 /100 | #199 | Fair $100,119 |
| Spanish | 20.1 /100 | #200 | Fair $99,977 |
| Immigrants | Thailand | 19.0 /100 | #201 | Poor $99,840 |
| Whites/Caucasians | 18.7 /100 | #202 | Poor $99,800 |
| Scotch-Irish | 17.1 /100 | #203 | Poor $99,591 |
| Ghanaians | 12.6 /100 | #204 | Poor $98,877 |
| Hawaiians | 12.5 /100 | #205 | Poor $98,869 |
| Immigrants | Iraq | 12.1 /100 | #206 | Poor $98,786 |
| Aleuts | 11.6 /100 | #207 | Poor $98,702 |
| Immigrants | Uruguay | 9.2 /100 | #208 | Tragic $98,205 |
| Immigrants | Colombia | 8.7 /100 | #209 | Tragic $98,067 |
| Puget Sound Salish | 8.2 /100 | #210 | Tragic $97,958 |
| Immigrants | Sudan | 7.4 /100 | #211 | Tragic $97,737 |
Demographics Similar to Immigrants from El Salvador by Median Family Income
In terms of median family income, the demographic groups most similar to Immigrants from El Salvador are Immigrants from Guyana ($92,513, a difference of 0.030%), Immigrants from Somalia ($92,609, a difference of 0.070%), Immigrants from Barbados ($92,419, a difference of 0.14%), West Indian ($92,765, a difference of 0.24%), and Immigrants from Ecuador ($92,837, a difference of 0.32%).
| Demographics | Rating | Rank | Median Family Income |
| Immigrants | Middle Africa | 1.0 /100 | #245 | Tragic $93,593 |
| Guyanese | 0.9 /100 | #246 | Tragic $93,373 |
| Immigrants | Senegal | 0.7 /100 | #247 | Tragic $92,912 |
| French American Indians | 0.7 /100 | #248 | Tragic $92,872 |
| Immigrants | Ecuador | 0.7 /100 | #249 | Tragic $92,837 |
| West Indians | 0.6 /100 | #250 | Tragic $92,765 |
| Immigrants | Somalia | 0.6 /100 | #251 | Tragic $92,609 |
| Immigrants | El Salvador | 0.6 /100 | #252 | Tragic $92,545 |
| Immigrants | Guyana | 0.6 /100 | #253 | Tragic $92,513 |
| Immigrants | Barbados | 0.5 /100 | #254 | Tragic $92,419 |
| Immigrants | Laos | 0.5 /100 | #255 | Tragic $92,239 |
| Nicaraguans | 0.5 /100 | #256 | Tragic $92,231 |
| Americans | 0.4 /100 | #257 | Tragic $92,096 |
| Osage | 0.4 /100 | #258 | Tragic $91,926 |
| Cape Verdeans | 0.4 /100 | #259 | Tragic $91,848 |