Ghanaian vs Colville Median Family Income
COMPARE
Ghanaian
Colville
Median Family Income
Median Family Income Comparison
Ghanaians
Colville
$98,877
MEDIAN FAMILY INCOME
12.6/ 100
METRIC RATING
204th/ 347
METRIC RANK
$85,792
MEDIAN FAMILY INCOME
0.0/ 100
METRIC RATING
301st/ 347
METRIC RANK
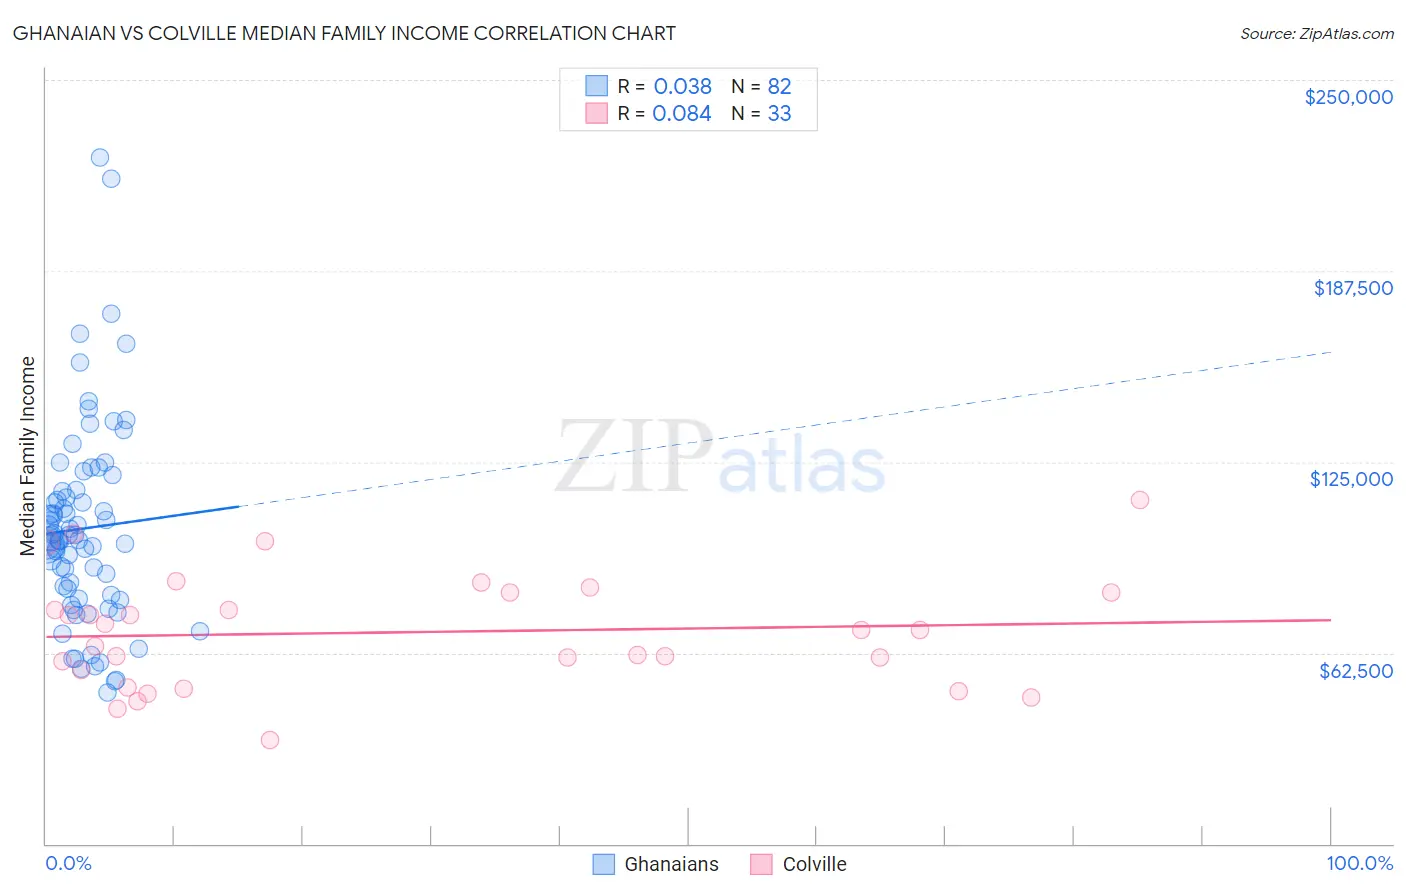
Ghanaian vs Colville Median Family Income Correlation Chart
The statistical analysis conducted on geographies consisting of 190,476,468 people shows no correlation between the proportion of Ghanaians and median family income in the United States with a correlation coefficient (R) of 0.038 and weighted average of $98,877. Similarly, the statistical analysis conducted on geographies consisting of 34,680,416 people shows a slight positive correlation between the proportion of Colville and median family income in the United States with a correlation coefficient (R) of 0.084 and weighted average of $85,792, a difference of 15.2%.
Median Family Income Correlation Summary
| Measurement | Ghanaian | Colville |
| Minimum | $49,625 | $33,824 |
| Maximum | $224,545 | $112,639 |
| Range | $174,920 | $78,815 |
| Mean | $103,158 | $69,185 |
| Median | $99,461 | $70,000 |
| Interquartile 25% (IQ1) | $81,320 | $53,997 |
| Interquartile 75% (IQ3) | $115,481 | $82,061 |
| Interquartile Range (IQR) | $34,161 | $28,064 |
| Standard Deviation (Sample) | $32,730 | $18,382 |
| Standard Deviation (Population) | $32,529 | $18,102 |
Similar Demographics by Median Family Income
Demographics Similar to Ghanaians by Median Family Income
In terms of median family income, the demographic groups most similar to Ghanaians are Hawaiian ($98,869, a difference of 0.010%), Immigrants from Iraq ($98,786, a difference of 0.090%), Aleut ($98,702, a difference of 0.18%), Immigrants from Uruguay ($98,205, a difference of 0.68%), and Scotch-Irish ($99,591, a difference of 0.72%).
| Demographics | Rating | Rank | Median Family Income |
| Immigrants | Cameroon | 22.8 /100 | #197 | Fair $100,289 |
| Immigrants | Africa | 22.5 /100 | #198 | Fair $100,256 |
| Yugoslavians | 21.3 /100 | #199 | Fair $100,119 |
| Spanish | 20.1 /100 | #200 | Fair $99,977 |
| Immigrants | Thailand | 19.0 /100 | #201 | Poor $99,840 |
| Whites/Caucasians | 18.7 /100 | #202 | Poor $99,800 |
| Scotch-Irish | 17.1 /100 | #203 | Poor $99,591 |
| Ghanaians | 12.6 /100 | #204 | Poor $98,877 |
| Hawaiians | 12.5 /100 | #205 | Poor $98,869 |
| Immigrants | Iraq | 12.1 /100 | #206 | Poor $98,786 |
| Aleuts | 11.6 /100 | #207 | Poor $98,702 |
| Immigrants | Uruguay | 9.2 /100 | #208 | Tragic $98,205 |
| Immigrants | Colombia | 8.7 /100 | #209 | Tragic $98,067 |
| Puget Sound Salish | 8.2 /100 | #210 | Tragic $97,958 |
| Immigrants | Sudan | 7.4 /100 | #211 | Tragic $97,737 |
Demographics Similar to Colville by Median Family Income
In terms of median family income, the demographic groups most similar to Colville are Spanish American Indian ($85,728, a difference of 0.070%), Hispanic or Latino ($85,647, a difference of 0.17%), Mexican ($85,618, a difference of 0.20%), Paiute ($85,414, a difference of 0.44%), and Immigrants from Dominica ($85,411, a difference of 0.45%).
| Demographics | Rating | Rank | Median Family Income |
| Fijians | 0.0 /100 | #294 | Tragic $87,387 |
| Yaqui | 0.0 /100 | #295 | Tragic $87,289 |
| Immigrants | Guatemala | 0.0 /100 | #296 | Tragic $87,191 |
| Cajuns | 0.0 /100 | #297 | Tragic $87,157 |
| Immigrants | Latin America | 0.0 /100 | #298 | Tragic $86,989 |
| Chippewa | 0.0 /100 | #299 | Tragic $86,852 |
| Ottawa | 0.0 /100 | #300 | Tragic $86,380 |
| Colville | 0.0 /100 | #301 | Tragic $85,792 |
| Spanish American Indians | 0.0 /100 | #302 | Tragic $85,728 |
| Hispanics or Latinos | 0.0 /100 | #303 | Tragic $85,647 |
| Mexicans | 0.0 /100 | #304 | Tragic $85,618 |
| Paiute | 0.0 /100 | #305 | Tragic $85,414 |
| Immigrants | Dominica | 0.0 /100 | #306 | Tragic $85,411 |
| Chickasaw | 0.0 /100 | #307 | Tragic $85,356 |
| U.S. Virgin Islanders | 0.0 /100 | #308 | Tragic $85,294 |